参考文档:
https://blog.csdn.net/guoyinzhao/article/details/81283761
https://cizixs.com/2018/01/24/use-prometheus-and-grafana-to-monitor-linux-machine/
https://www.linuxidc.com/Linux/2018-01/150354.htm ( 比较详细)
1. 实验说明
Prometheus 监控 为 C/S 架构。
实验主机分布如下:
| IP | 用途 | 服务 |
|---|---|---|
| 192.168.2.21 | server | Prometheus, |
| 192.168.2.22 | client | exporter |
| 192.168.2.23 | client | Grafana |
1.1 准备工作
对所有主机做如下操作
# 关闭selinuxsetenforce 0 && sed -i s/SELINUX=enforce/SELINUX=disabled/g /etc/selinux/config# 关闭防火墙systemctl stop firewalld && systemctl disable firewalld# 安装 epel源yum install -y epel-release# 安装docker 并启动yum install -y dockersystemctl start docker && systemctl enable docker
2. 基础环境安装
2.1 server主机上安装 Prometheus
- 创建 prometheus配置文件
mkdir /etc/prometheus/vim /etc/prometheus/prometheus.ymlmkdir /data/prometheuschmod -R 777 /data/prometheus
global:scrape_interval: 60sevaluation_interval: 60sscrape_configs:- job_name: prometheusstatic_configs:- targets: ['localhost:9090']labels:instance: prometheus- job_name: linuxstatic_configs:- targets: ['192.168.2.21:9100']labels:instance: db1- targets: ['192.168.2.22:9100']labels:instance: db1- job_name: mysqlstatic_configs:- targets: ['192.168.2.23:9104']labels:instance: db1
- 启动docker-prometheus
docker run --name prometheus -it -d \-p 9090:9090 \-v /etc/prometheus/:/etc/prometheus/ \-v /etc/prometheus/rules:/etc/prometheus/rules \-v /data/prometheus:/prometheus \--restart=always \quay.io/prometheus/prometheus \--config.file=/etc/prometheus/prometheus.yml \ # 可进入docker容器, prometheus --help 查看用法 \--web.enable-lifecycle # Enable shutdown and reload via HTTP request.
2.2 在client 主机上安装 exporter
这里的
docker-exporter的网络模式要运行为host模式。
在这个模式下,docker 不会为容器创建单独的网络 namespace,而是共享主机的 network namespace,也就是说:容器可以直接访问主机上所有的网络信息。
docker run -d \-p 9100:9100 \--restart=always \--name node-exporter \-v "/proc:/host/proc" \-v "/sys:/host/sys" \-v "/nodefs:/rootfs" \--net="host" \quay.io/prometheus/node-exporter:latest \--collector.filesystem.ignored-mount-points="^/(dev|proc|sys|var/lib/docker)($|/)" # 可进入docker容器, node_exporter --help 查看用法# docker run -d -p 9100:9100 --name node-exporter quay.io/prometheus/node-exporter:latest
查看所配置的node信息是否上线: http://192.168.2.21:9090/targets
3. 安装运行Grafana
# 创建数据目录mkdir /data/grafana_db -pchmod -R 777 /data/grafana_db# 启动grafanadocker run -d \-p 3000:3000 \--name grafana \-v /data/grafana_db:/var/lib/grafana \-e "GF_SECURITY_ADMIN_PASSWORD=admin" \--restart=always \grafana/grafana:5.1.3# 默认的帐号/密码为admin/admin# docker run -d -p 3000:3000 --name grafana grafana/grafana:5.1.3
安装插件:
# 安装饼图插件grafana-cli plugins install grafana-piechart-panel
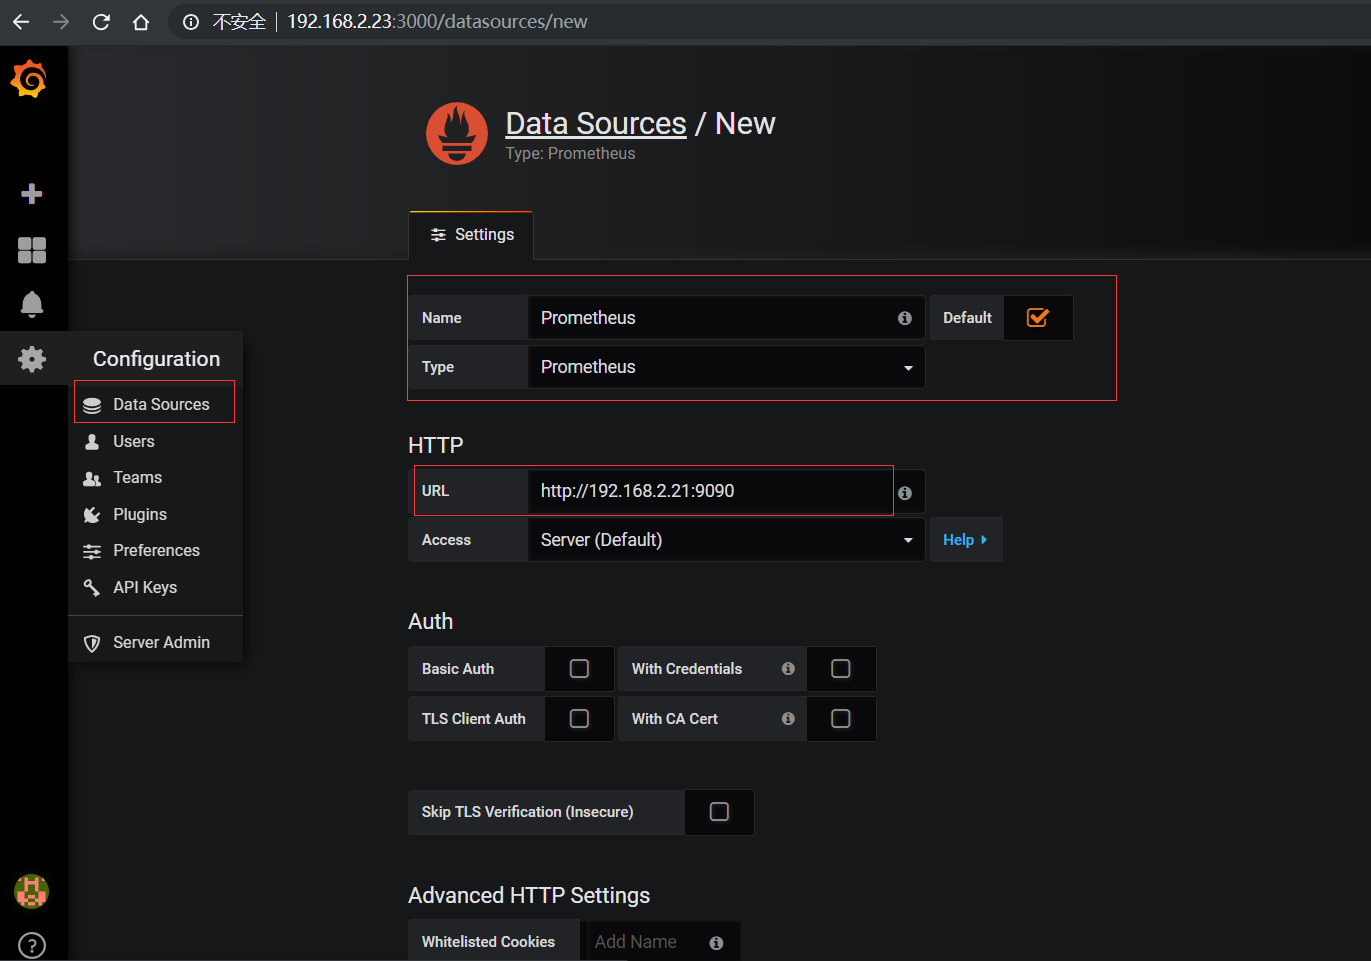
3.1 为grafana添加Prometheus数据源。
3.2 添加监控模版
上面我们把
Prometheus的数据导入了grafana, 接下来,我们添加监控模版,让数据展示出来。
监控模板地址)
下载模版: https://grafana.com/api/dashboards/ ID_NUM /revisions/1/download ( ID_NUM:改为模版的ID号 )
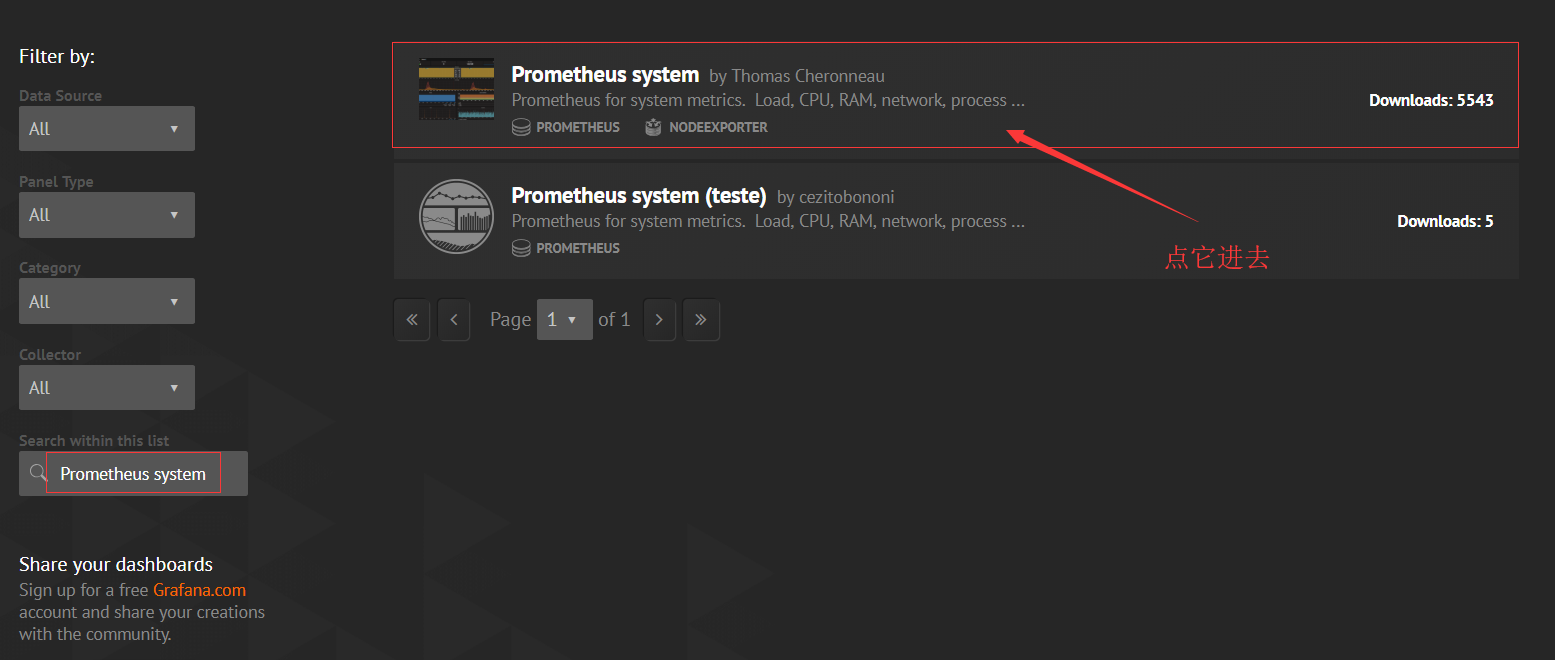
3.2.1 主机监控
- 搜索
Prometheus system: 添加主机监控模版

注意: Grafana 的版本,不然数据可能出不来
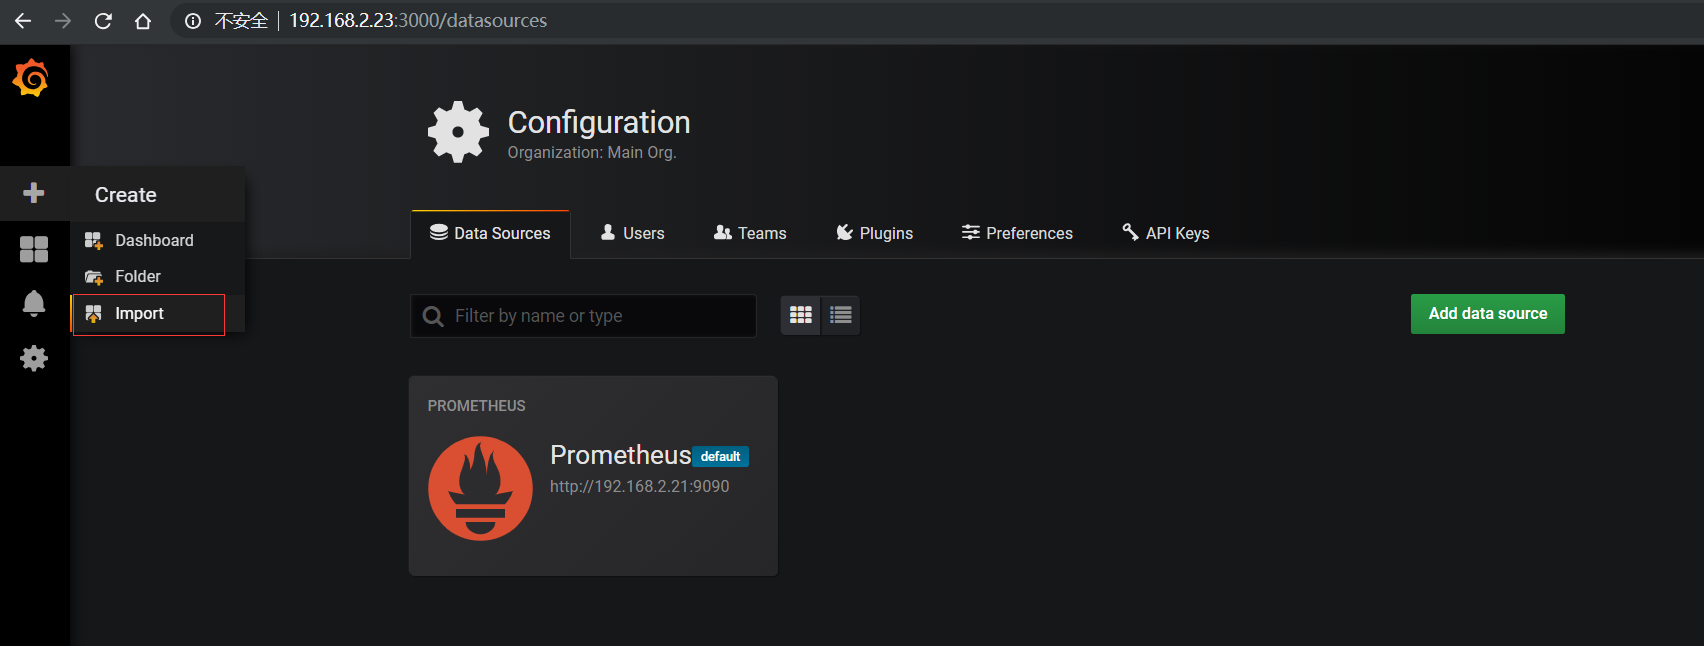
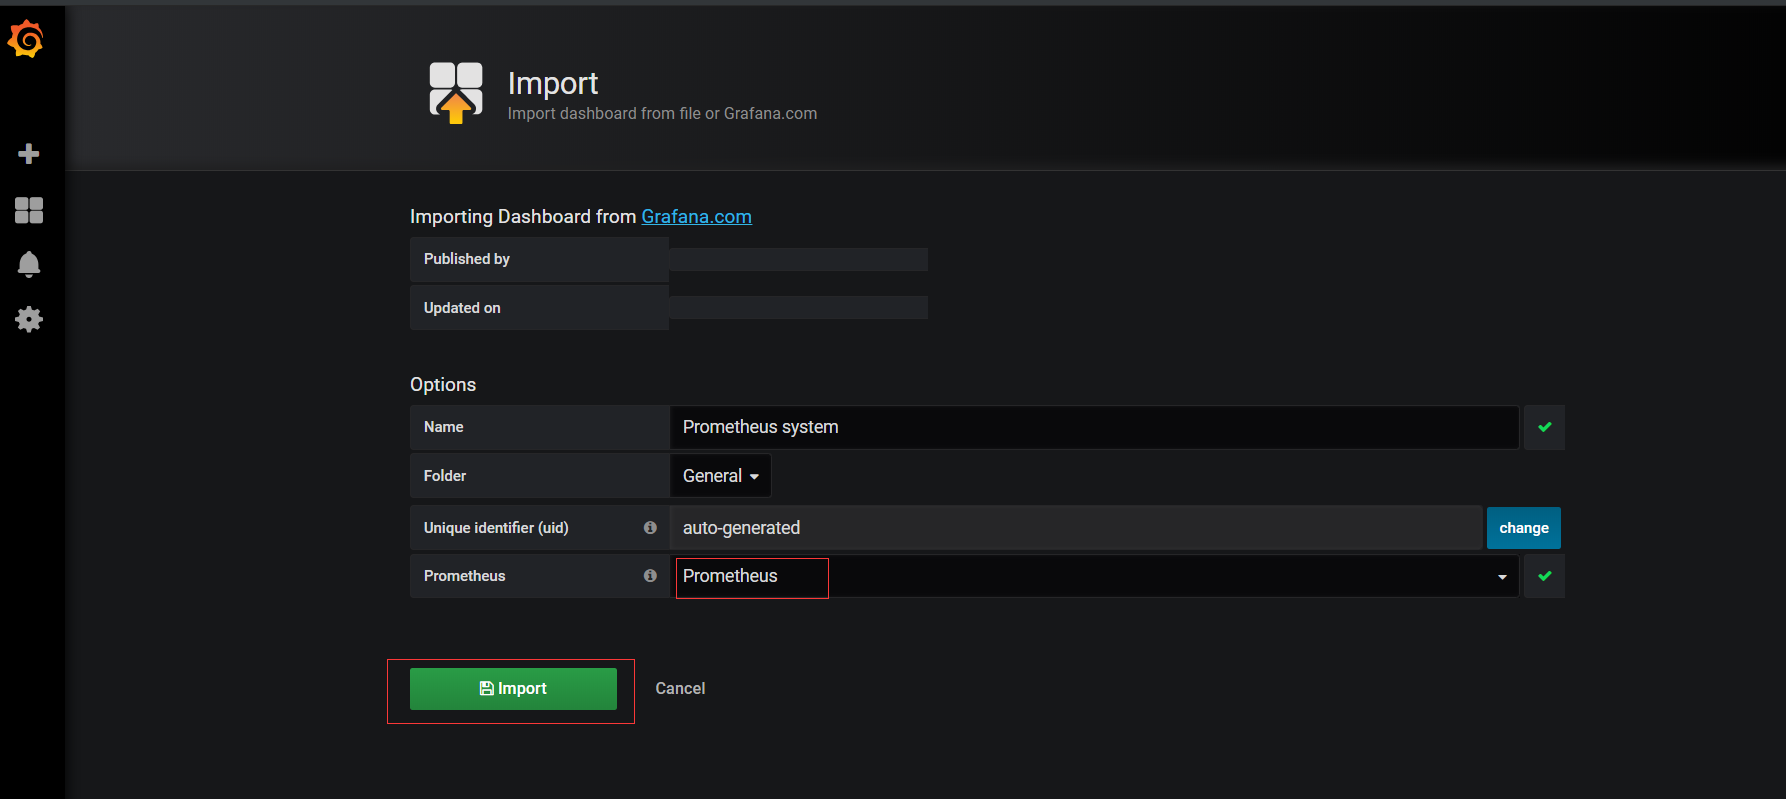
- 导入模版

若有收获,就点个赞吧
0 人点赞
