prometheus 的高级监控方案, 请参考官方文档 https://prometheus.io/docs/instrumenting/exporters/
prometheus数据写到es
可以使用 prometheus beat 将数据传送到es 中。
promethuesbeat 项目地址: https://github.com/infonova/prometheusbeat
# promethuesbeat 项目 docker 启动docker run -d \--restart always \--name prometheusbeat \-p 8080:8080 \-v /etc/prometheusbeat/prometheusbeat.yml:/prometheusbeat.yml \infonova/prometheusbeat:latest# 在 prometheus 中加下配置remote_write:url: "http://{prometheusbeat_IP}:8080/prometheus"
prometheus 之 SNMP 监控
下面的方法虽然可以采集到数据,但是没有一个好的 grafana dashboard. 建议监控网络流量还是用 cacti 比较好。
参考文档: https://blog.csdn.net/YUKEKECHEN/article/details/85960248
安装
# 安装 snmp_export# 项目地址: https://github.com/prometheus/snmp_exporteryum -y install net-snmpdocker run -d \--restart always \--name snmp_export \-p 9116:9116 \prom/snmp-exporter# 在prometheus 中加如下配置:- job_name: 'snmp'static_configs:- targets:- 192.168.1.1 # 网关地址labels:tag: aliyun-hb2-10metrics_path: /snmpparams:module: [if_mib]relabel_configs:- source_labels: [__address__]target_label: __param_target- source_labels: [__param_target]target_label: instance- target_label: __address__replacement: {snmp_export_IP}:9116
验证snmp监控数据
curl http://{snmp_export_IP}:9116/snmp?target={交换机_snmp地址}&module=if_mibeg: curl http://172.25.20.90:9116/snmp?target=10.10.10.253&module=if_mib
配置snmp告警指标
vim /etc/prmetheus/rules/traffic.yml
groups:- name: trafficrules:- record: traffic_out_bpsexpr: (ifHCOutOctets - (ifHCOutOctets offset 1m)) *8/60#expr: sum by (tag, job, instance, ifIndex) ((ifHCOutOctets - (ifHCOutOctets offset 1m)) *8/60)#labels:# instance: ""# ifIndex: ""- record: traffic_in_bpsexpr: (ifHCInOctets - (ifHCInOctets offset 1m)) *8/60### alert- alert: BeijingProxyTrafficOutProblemexpr: (sum by(tag) (avg_over_time(traffic_out_bps{ifIndex=~"7|9", tag=~"beijing.+"}[5m]) /1024/1024)) >= 200for: 2mlabels:level: CRITICALannotations:message: "traffic out has problem (network: , current: Mbps)"- alert: BeijingProxyTrafficInProblemexpr: (sum by(tag) (avg_over_time(traffic_in_bps{ifIndex=~"7|9", tag=~"beijing.+"}[5m]) /1024/1024)) >= 500for: 2mlabels:level: CRITICALannotations:message: "traffic in has problem (network: , current: Mbps)"- alert: BeijingProxyWanTrafficOutProblemexpr: (sum by(tag) (avg_over_time(traffic_out_bps{ifIndex=~"6|8", tag=~"beijing.+"}[5m]) /1024/1024)) >= 30for: 2mlabels:level: CRITICALannotations:message: "traffic out bond0 has problem (network: , current: Mbps)"- alert: BeijingProxyWanTrafficInProblemexpr: (sum by(tag) (avg_over_time(traffic_in_bps{ifIndex=~"6|8", tag=~"beijing.+"}[5m]) /1024/1024)) >= 30for: 2mlabels:level: CRITICALannotations:message: "traffic in bond0 has problem (network: , current: Mbps)"- alert: AliyunProxyTrafficOutProblemexpr: (sum by(tag) (avg_over_time(traffic_out_bps{ifIndex="2", tag=~"aliyun.+"}[5m]) /1024/1024)) > 200for: 2mlabels:level: CRITICALannotations:message: "traffic out has problem (network: , current: Mbps)"- alert: AliyunProxyTrafficInProblemexpr: (sum by(tag) (avg_over_time(traffic_in_bps{ifIndex="2", tag=~"aliyun.+"}[5m]) /1024/1024)) > 200for: 2mlabels:level: CRITICALannotations:message: "traffic in has problem (network: , current: Mbps)"
prometheus 之 网络服务监控
Prometheus提供了一个blackbox_exporter可以实现网络监控,支持http、dns、tcp、icmp等监控
- github项目地址: https://github.com/prometheus/blackbox_exporter
配置文件
blackbox_exporter 配置文件, blackbox.yml
modules:http_2xx:prober: httptimeout: 10shttp:preferred_ip_protocol: "ip4" ##如果http监测是使用ipv4 就要写上,目前国内使用ipv6很少。http_post_2xx_query: ##用于post请求使用的模块)由于每个接口传参不同 可以定义多个module 用于不同接口(例如此命名为http_post_2xx_query 用于监测query.action接口prober: httptimeout: 15shttp:preferred_ip_protocol: "ip4" ##使用ipv4method: POSTheaders:Content-Type: application/json ##header头body: '{"hmac":"","params":{"publicFundsKeyWords":"xxx"}}' ##传参tcp_connect:prober: tcppop3s_banner:prober: tcptcp:query_response:- expect: "^+OK"tls: truetls_config:insecure_skip_verify: falsessh_banner:prober: tcptcp:query_response:- expect: "^SSH-2.0-"irc_banner:prober: tcptcp:query_response:- send: "NICK prober"- send: "USER prober prober prober :prober"- expect: "PING :([^ ]+)"send: "PONG ${1}"- expect: "^:[^ ]+ 001"# icmp:# prober: icmp# timeout: 5s# icmp:ping: # icmp 检测模块prober: icmptimeout: 5sicmp:preferred_ip_protocol: "ip4"
安装
### 启动blackbox_exporterdocker run -d -p 9115:9115 --name blackbox_exporter \--restart=always \-v /etc/prometheus/blackbox.yml:/etc/prometheus/blackbox.yml \docker.io/prom/blackbox-exporter \--config.file=/etc/prometheus/blackbox.yml
对于没有使用docker 启动的用户要注意:
- 一般情况下都会以非root用户运行
blackbox_exporter,这里使用的prometheus用户,Wie了使用icmp prober,需要设置CAP_NET_RAW,即对可执行文件blackbox_exporter执行下面的命令:setcap cap_net_raw+ep blackbox_exporter
使用场景
ping 检测
在prometheus 中加如下配置
#### 网络服务监控 -- ping ####- job_name: 'ping_all'scrape_interval: 1mmetrics_path: /probeparams:module: [ping]static_configs:- targets:- 192.168.2.107labels:instance: test01- targets:- 192.168.2.108labels:instance: test02relabel_configs:- source_labels: [__address__]target_label: __param_target- target_label: __address__replacement: 172.25.20.91:9115 # blackbox_exporter的地址:端口
- 验证:
curl "http://localhost:9115/probe?module=ping&target=192.168.2.107"
返回的是192.168.2.107这个target的metrics。
http 检测
以前面的最基本的module配置为例,在Prometheus的配置文件中配置使用http_2xx module:
在 prometheus 加入如下配置:
### http ###- job_name: 'blackbox-http'metrics_path: /probeparams:module: [http_2xx] # Look for a HTTP 200 response.static_configs:- targets:- http://192.168.3.214:8803/zlead- http://prometheus.io # Target to probe with https.- https://prometheus.io # Target to probe with https.relabel_configs:- source_labels: [__address__]target_label: __param_target- source_labels: [__param_target]target_label: instance- target_label: __address__replacement: 172.25.20.91:9115 # The blackbox exporter's real hostname:port
- 使配置生效
curl -X POST 172.25.20.90:9090/-/reload
- 检验:
curl "http://localhost:9115/probe?module=http_2xx&target=prometheus.io" 或:curl "http://localhost:9115/probe?target=prometheus.io&module=http_2xx&debug=true"
- 指标中的
probe_success1: http有效, 0: http无效。 可以通过此指标来进行监控。
TCP 测试
- 业务组件端口状态监听
- 应用层协议定义与监听
在 prometheus 中加入如下配置,
### TCP 端口监听 #### 类似于telnet- job_name: "blackbox_telnet_port]"scrape_interval: 5smetrics_path: /probeparams:module: [tcp_connect]static_configs:- targets: ['192.168.2.108:3306']labels:group: 'mysql-server'- targets: ['192.168.2.208:80']labels:group: 'Process status of nginx(main) server'relabel_configs:- source_labels: [__address__]target_label: __param_target- source_labels: [__param_target]target_label: instance- target_label: __address__replacement: 172.25.20.91:9115 # The blackbox exporter's real hostname:port
POST 测试
- 接口联通性
- 监听业务接口地址,用来判断接口是否在线
- 相关代码块添加到 Prometheus 文件内
- 对应 blackbox.yml文件的 http_post_2xx_query 模块(监听query.action这个接口)
### http-post ###- job_name: 'blackbox_http_2xx_post'scrape_interval: 10smetrics_path: /probeparams:module: [http_post_2xx_query]static_configs:- targets:- http://lphr.com/#/loginlabels:group: 'Interface monitoring'relabel_configs:- source_labels: [__address__]target_label: __param_target- source_labels: [__param_target]target_label: instance- target_label: __address__replacement: 172.25.20.91:9115 # The blackbox exporter's real hostname:port
告警测试
网络服务告警
icmp、tcp、http、post 监测是否正常可以观察probe_success 这一指标
- probe_success == 0 ##联通性异常
- probe_success == 1 ##联通性正常
告警也是判断这个指标是否等于0,如等于0 则触发异常报警
在 /etc/prometheus/rules/ 下增加告警规则: blackbox-alert.yml
groups:- name: blackbox_network_statsrules:- alert: blackbox_network_statsexpr: probe_success == 0for: 1mlabels:severity: criticalannotations:summary: "Instance {{ $labels.instance }} is down"description: "This requires immediate action!"
https证书预警
http检测除了可以探测http服务的存活外,还可以根据指标probe_ssl_earliest_cert_expiry进行ssl证书有效期预警。
http://{prometheus_IP}:9090/graph 中输入 probe_ssl_earliest_cert_expiry 即可查看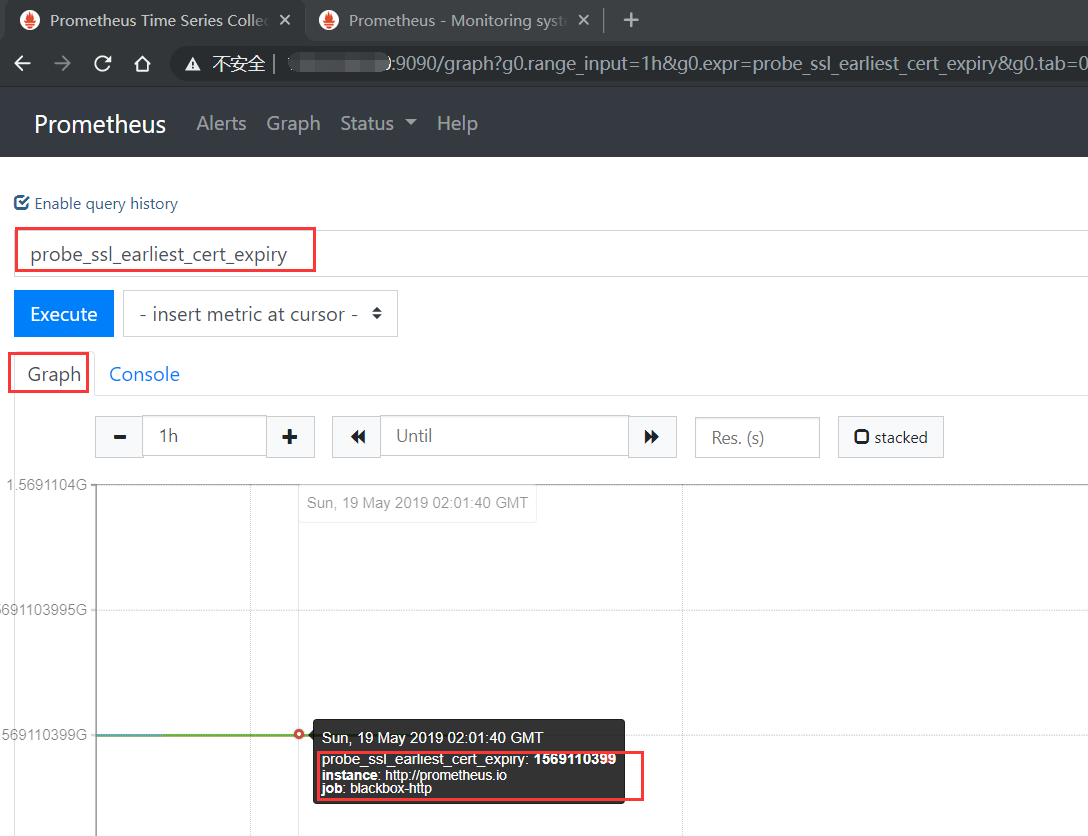
在 /etc/prometheus/rules/ 下增加告警规则: blackbox-https-alert.yml
groups:- name: ssl_expiry.rulesrules:- alert: SSLCertExpiringSoonexpr: probe_ssl_earliest_cert_expiry{job="blackbox-http"} - time() < 86400 * 30 # 过期前30天提醒for: 10m!
参考文档

若有收获,就点个赞吧
0 人点赞
