导包
import pandas as pdimport numpy as npimport matplotlib.pyplot as pltfrom sklearn.preprocessing import MinMaxScalerimport tensorflow as tffrom tensorflow.keras.datasets import boston_housingfrom tensorflow.keras.models import Modelfrom tensorflow.keras.preprocessing import sequencefrom tensorflow.keras.layers import Dense,Dropoutfrom tensorflow.keras import utilsfrom tensorflow.keras import regularizers
pandas
显示所有行/列
import pandas as pd#显示所有列pd.set_option('display.max_columns', None)#显示所有行pd.set_option('display.max_rows', None)#设置value的显示长度为100,默认为50pd.set_option('max_colwidth',100)
选取某些行和列
选取等于某些值的行记录 用 ==df.loc[df['column_name'] == some_value]选取某列是否是某一类型的数值 用 isindf.loc[df['column_name'].isin(some_values)]多种条件的选取 用 &df.loc[(df['column'] == some_value) & df['other_column'].isin(some_values)]选取不等于某些值的行记录 用 !=df.loc[df['column_name'] != some_value]isin返回一系列的数值,如果要选择不符合这个条件的数值使用~df.loc[~df['column_name'].isin(some_values)]
乱序
# 乱序方法1df.sample(frac=1)# 乱序后重新建立顺序性索引df.sample(frac=1).reset_index(drop=True)# 乱序方法2from sklearn.utils import shuffledf = shuffle(df)# 乱序后重新建立顺序性索引df = shuffle(df).reset_index(drop=True)
文件I/O操作
使用open读写文件
# open("文件路径","操作") w:写入 r:读取 a:追加with open("test.txt","w") as f:string = "i am {}\n"for i in range(10):f.write(string.format(i))#--------------------------------------------------slist = []with open("test.txt","r") as f:slist=f.read()for line in f:print(line)print(slist)
pickle
# 万能保存库import pickle# 保存模型with open('model_name.pkl','wb') as f:pickle.dump(model,f)# 加载模型with open('model_name.pkl','rb') as f:pkl_model = pickle.load(f)
OS操作
import oscurrent_path = os.path.dirname(__file__)
流式 json读取
import ijsonwith open('test.json', 'r', encoding='utf-8') as f:objects = ijson.items(f, 'earth.europe.item')#这个objects在这里就是相当于一个生成器,可以调用next函数取它的下一个值while True:try:print(objects.__next__())except StopIteration as e:print("数据读取完成")break
压缩解压操作
常见cmd命令和linux命令
python方法解压缩
时间操作
以年月日时分秒输出当前时间
import timecurrent_time = time.strftime("%Y-%m-%d %H:%M:%S",time.localtime())print(current_time)##输出结果:2021-03-22 15:13:06
计数函数
import timedef run_time(start_time):current_time = time.strftime("%Y-%m-%d %H:%M:%S",time.localtime())print(f"当前时间:{current_time}")print("耗时:%.3f sec" %(time.time()-start_time))passstart = time.time()# -------run main---------for i in range(2):time.sleep(1)pass# ------------------------run_time(start)## 输出结果:# 当前时间:2021-03-22 15:24:11# 耗时:2.000 sec
保存最有模型日志
best_score = 0global best_score# 每次只保存高于best_score的模型和参数if best_score < eval_accuracy / nb_eval_steps:best_score = eval_accuracy / nb_eval_steps# 保存模型权重save(model, optimizer,best_score)# 记录最佳分数日志current_time = time.strftime("%Y-%m-%d %H:%M:%S", time.localtime())with open("./run_log.txt", "a", encoding="utf-8") as f:print(str(current_time)+" best_score:" + str(best_score) + " save_model_path:" + output_model_path)f.write(str(current_time) + " best_score:" + str(best_score) + " save_model_path:" + output_model_path+ "\n")
画图
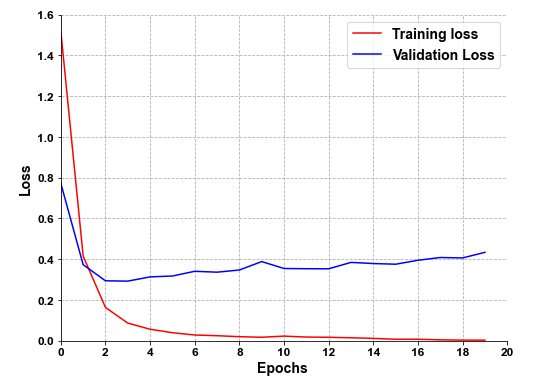
论文配图1
import matplotlib.pyplot as pltplt.rcParams['font.sans-serif'] = ['Arial'] # 如果要显示中文字体,则在此处设为:SimHeiplt.rcParams['axes.unicode_minus'] = False # 显示负号colors = ['salmon','lightskyblue','#FFF68F','palegreen','lightpink','silver','burlywood','plum','rosybrown']# plt.switch_backend('agg')plt.figure(figsize=(8,6))plt.grid(linestyle="--") # 设置背景网格线为虚线ax = plt.gca()ax.spines['top'].set_visible(False) # 去掉上边框ax.spines['right'].set_visible(False) # 去掉右边框plt.plot(history.history['loss'], "red", linewidth=1.5)plt.plot(history.history['val_loss'], 'blue', linewidth=1.5)plt.legend(['Training loss', 'Validation Loss'], fontsize=14)leg = plt.gca().get_legend()ltext = leg.get_texts()plt.setp(ltext, fontsize=14, fontweight='bold') # 设置图例字体的大小和粗细plt.xticks([x*2 for x in range(0,20)],fontsize=12, fontweight='bold') # 默认字体大小为10plt.yticks(fontsize=12, fontweight='bold')plt.xlabel('Epochs ', fontsize=14,fontweight='bold')plt.ylabel('Loss', fontsize=14,fontweight='bold')plt.xlim(0,20) # 设置x轴的范围plt.ylim(0,1.6) # 设置y轴的范围fig1.savefig('./img/loss_TextAttBiRNN.png')plt.show()

若有收获,就点个赞吧
0 人点赞
