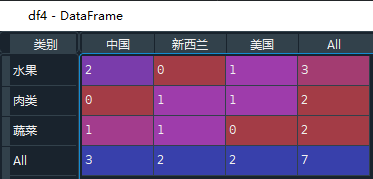
交叉表是用于统计分组频率的特殊透视表,crosstab()可以处理分类数据。它可用于将两个或多个变量分组,并为每组的给定值执行计算
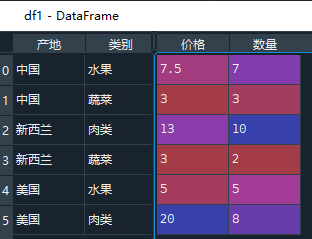
透视表就是将指定原有DataFrame的列分别作为行索引和列索引,然后对指定的列应用聚集函数(默认情况下式mean函数)。
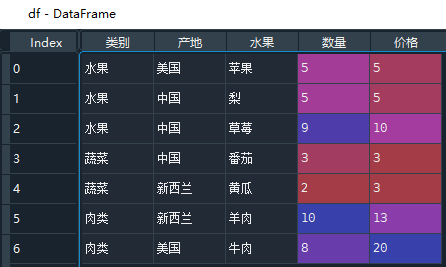
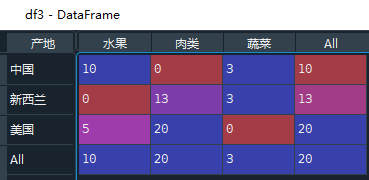
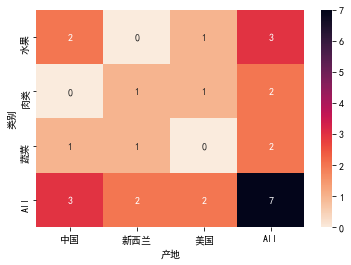
import numpy as npimport pandas as pdimport seaborn as snsimport matplotlib.pyplot as plt"""1:透视表(pivotTab)透视表是将原有的DataFrame的列分别作为行索引和列索引,然后对指定的列应用聚集函数"""df = pd.DataFrame({'类别':['水果','水果','水果','蔬菜','蔬菜','肉类','肉类'],'产地':['美国','中国','中国','中国','新西兰','新西兰','美国'],'水果':['苹果','梨','草莓','番茄','黄瓜','羊肉','牛肉'],'数量':[5,5,9,3,2,10,8],'价格':[5,5,10,3,3,13,20]})df1=df.pivot_table(index=['产地','类别'])print(df)print(df1)#行索引为"产地",列索引为'类别'#对“价格”应用'max',并提供分项统计,缺失值填充0df3=df.pivot_table('价格',index='产地',columns='类别',aggfunc='max',margins=True,fill_value=0)print(df3)print("*******************交叉表的信息******************************")"""交叉表用于统计分组频率的特殊透视表"""df4=pd.crosstab(df['类别'],df['产地'],margins=True)print(df4)sns.heatmap(df4, cmap='rocket_r', annot=True, fmt='g')def plot_heatmap(cross_table, fmt='g'):fig, ax = plt.subplots(figsize=(8, 5))sns.heatmap(cross_table,annot=True,fmt=fmt,cmap='rocket_r',linewidths=.5,ax=ax)plt.show();plot_heatmap(df4, fmt='.2%')


若有收获,就点个赞吧
0 人点赞
