带区域的双折线
效果

代码
const xData = ['2020-7-01', '2020-7-02', '2020-7-03', '2020-7-04', '2020-7-05', '2020-7-06', '2020-7-07', '2020-7-08', '2020-7-09', '2020-7-10'];const startValue = '2020-7-03';const endValue = '2020-7-07';const yTwoData = ['7', '7', '7', '27', '27', '7', '7', '27', '27', '27'];const yOneData = ['13', '13', '13', '33', '33', '13', '13', '13', '13', '13'];option = { textStyle: { fontSize: 12, }, grid: { top: 150, right: 0, bottom: 150, left: 30, containLabel: true, }, dataZoom: [{ type: 'slider', bottom: 40, left: 40, startValue, endValue, }, { type: 'inside', }], xAxis: { data: xData, axisLine: { show: false, }, axisTick: { show: false, }, axisLabel: { color: '#333333', }, axisPointer: { type: 'line', lineStyle: { color: '#333333', type: 'dashed', } } }, yAxis: { min: 0, max: 40, offset: 0, splitLine: { show: false, }, axisLine: { show: false, }, axisTick: { show: false, }, axisLabel: { show: true, color: '#333333', fontSize: 20, lineHeight: 18, formatter: (value, index) => { switch (index) { case 1: return '异\n\n常'; case 3: return '正\n\n常'; default: return ''; } }, }, }, tooltip: { show: true, trigger: 'axis', backgroundColor: '#ffffff', borderWidth: 1, borderColor: '#333333', textStyle: { fontSize: 12, color: '#333333', }, }, series: [{ name: '正常背景', type: 'line', z: 1, markArea: { silent: true, itemStyle: { color: '#DDFAE4', }, data: [ [{ x: 40, yAxis: 21 }, { x: '100%', yAxis: 39 }] ], } }, { name: '异常背景', type: 'line', z: 1, markArea: { silent: true, itemStyle: { color: '#FFE9E9', }, data: [ [{ x: 40, yAxis: 1, }, { x: '100%', yAxis: 19 }] ], } }, { name: '双折线-上', type: 'line', z: 2, data: yOneData, symbol: 'circle', symbolSize: 4, itemStyle: { color: '#FF4D4F', }, lineStyle: { type: 'dashed', width: 2, color: '#FF4D4F' }, }, { name: '双折线-下', type: 'line', z: 2, data: yTwoData, symbol: 'circle', symbolSize: 4, itemStyle: { color: '#40A9FF', }, lineStyle: { type: 'dashed', width: 2, color: '#40A9FF', }, } ]};
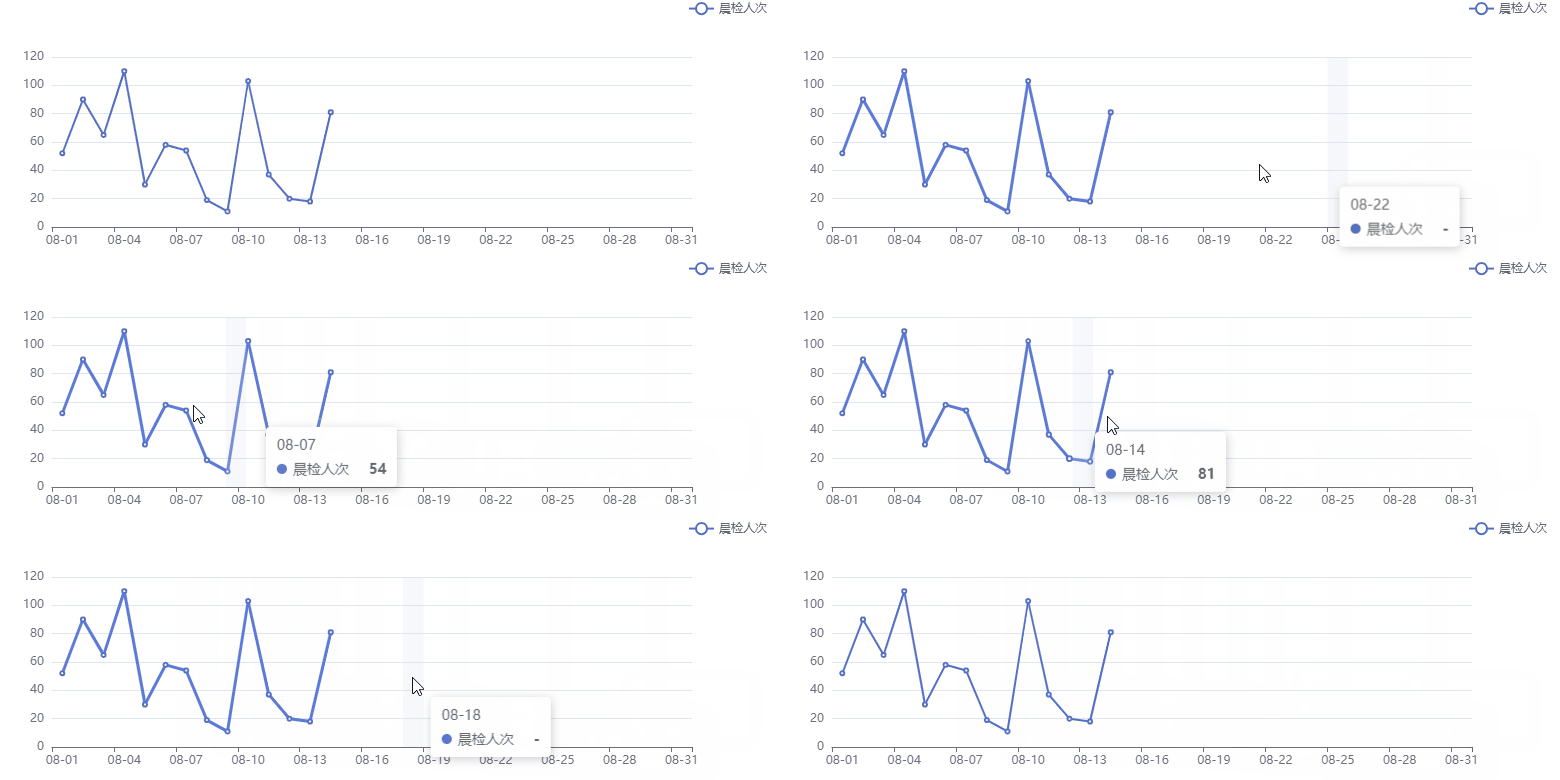
中间截断式折线图
效果

代码
import React, { useEffect, useRef } from 'react';import * as echarts from 'echarts';const xData = Array.from({ length: 31 }, () => 0).map((_, index) => `08-${index < 9 ? `0${index + 1}` : index + 1}`);const yData = Array.from({ length: 31 }, () => Math.ceil(Math.random() * 100 + 10));const option = { // grid: { // top: 30, // right: 60, // bottom: 30, // left: 60, // }, xAxis: { type: 'category', data: xData, }, yAxis: { type: 'value', }, legend: { show: true, right: 0, }, tooltip: { trigger: 'axis', axisPointer: { type: 'shadow', }, }, series: [ { name: '晨检人次', // 设置 undefined 则不显示 data: yData.map((item, index) => (index < 14 ? item : undefined)), type: 'line', }, ],};const Charts = () => { const chartRef = useRef(); const myChart = useRef(); const initChart = () => { if (!myChart.current && chartRef?.current) { myChart.current = echarts.init(chartRef.current); myChart.current.setOption(option); } }; useEffect(() => { initChart(); }, []); return <div style={{ width: 800, height: 300 }} ref={chartRef} />;};export default Charts;


