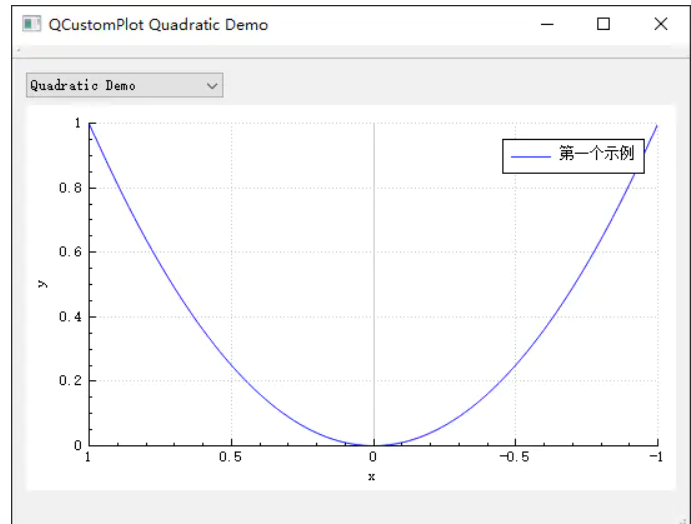
void MainWindow::setupQuadraticDemo(QCustomPlot *customPlot){QVector<double> x(101), y(101);for (int i = 0; i < 101; ++i) {x[i] = i / 50.0 - 1; // -1 到 1y[i] = x[i] * x[i];}customPlot->addGraph(); // 添加一个曲线图QGraphcustomPlot->graph(0)->setData(x, y); // 为曲线图添加数据customPlot->graph(0)->setName("第一个示例"); // 设置曲线图的名字customPlot->xAxis->setLabel("x"); // 设置x轴的标签customPlot->yAxis->setLabel("y");customPlot->xAxis->setRange(-1, 1); // 设置x轴的范围为(-1,1)customPlot->yAxis->setRange(0, 1);customPlot->legend->setVisible(true); // 显示图例}
效果图

若有收获,就点个赞吧
0 人点赞
