https://developer.mozilla.org/zh-CN/docs/Web/API/Performance**Performance** 接口可以获取到当前页面中与性能相关的信息。它是 High Resolution Time API 的一部分,同时也融合了 Performance Timeline API、Navigation Timing API、 User Timing API 和 Resource Timing API
该类型的对象可以通过调用只读属性 [Window.performance](https://developer.mozilla.org/zh-CN/docs/Web/API/performance_property) 来获得。
注意:除了以下指出的情况外,该接口及其成员在
Web Worker中可用。此外,还需注意,performance 的创建和衡量都是同一环境下的。即,如果你在主线程(或者其他 worker)中创建了一个 performance,那么它在另外的 worker 线程中是不可用的;反之亦然。
属性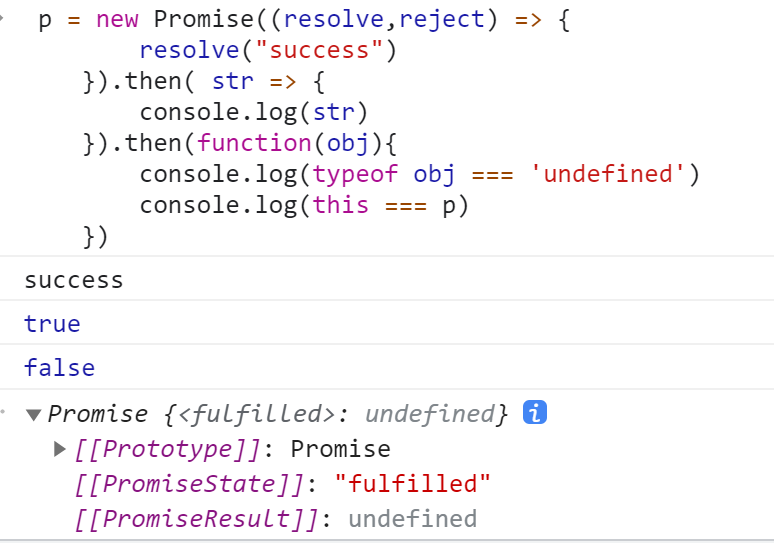
| 名称 | 详情 | 备注 |
|---|---|---|
| eventCounts | 事件数量 | 目前为实验室阶段,MDN上仍无具体解释。 |
| memory | 栈的使用情况 | 非标准 |
| navigation | 提供了在指定的时间段里发生的操作相关信息,包括页面是加载还是刷新、发生了多少次重定向等等 | 弃用 |
| onresourcetimingbufferfull | 一个回调的 [EventTarget](https://developer.mozilla.org/zh-CN/docs/Web/API/EventTarget),当浏览器的资源时间性能缓冲区已满时会触发 |
|
| timeOrigin | 性能测量开始时的时间的高精度时间戳。 | 非标准 |
| timing | [PerformanceTiming](https://developer.mozilla.org/zh-CN/docs/Web/API/PerformanceTiming)对象包含延迟相关的性能信息 |
弃用 |
navigation
interface PerformanceNavigation {const unsigned short TYPE_NAVIGATE = 0;const unsigned short TYPE_RELOAD = 1;const unsigned short TYPE_BACK_FORWARD = 2;const unsigned short TYPE_RESERVED = 255;readonly attribute unsigned short type;readonly attribute unsigned short redirectCount;};
该属性是一个对象,有两个属性值,分别是 redirectCount(重定向次数) 、 type(操作的类型):redirectCount
该属性值为几,就说明了当前页面重定向了多少次;typetype(0):当前页面是通过点击链接,书签和表单提交,或者脚本操作,或者在url中直接输入地址;type(1):点击刷新页面按钮或者通过Location.reload()方法显示的页面;type(2):页面通过历史记录和前进后退访问时;type(255):任何未由上述值定义的导航类型。
onresourcetimingbufferfull**onresourcetimingbufferfull**属性是一个在resourcetimingbufferfull事件触发时会被调用的 [event handler](https://developer.mozilla.org/en-US/docs/Web/Events/Event_handlers) 。这个事件当浏览器的资源时间性能缓冲区已满时会触发。
下面的示例在onresourcetimingbufferfull属性上设置一个回调函数。
function buffer_full(event) {console.log("WARNING: Resource Timing Buffer is FULL!");performance.setResourceTimingBufferSize(200);}function init() {// Set a callback if the resource buffer becomes filledperformance.onresourcetimingbufferfull = buffer_full;}<body onload="init()">
timing
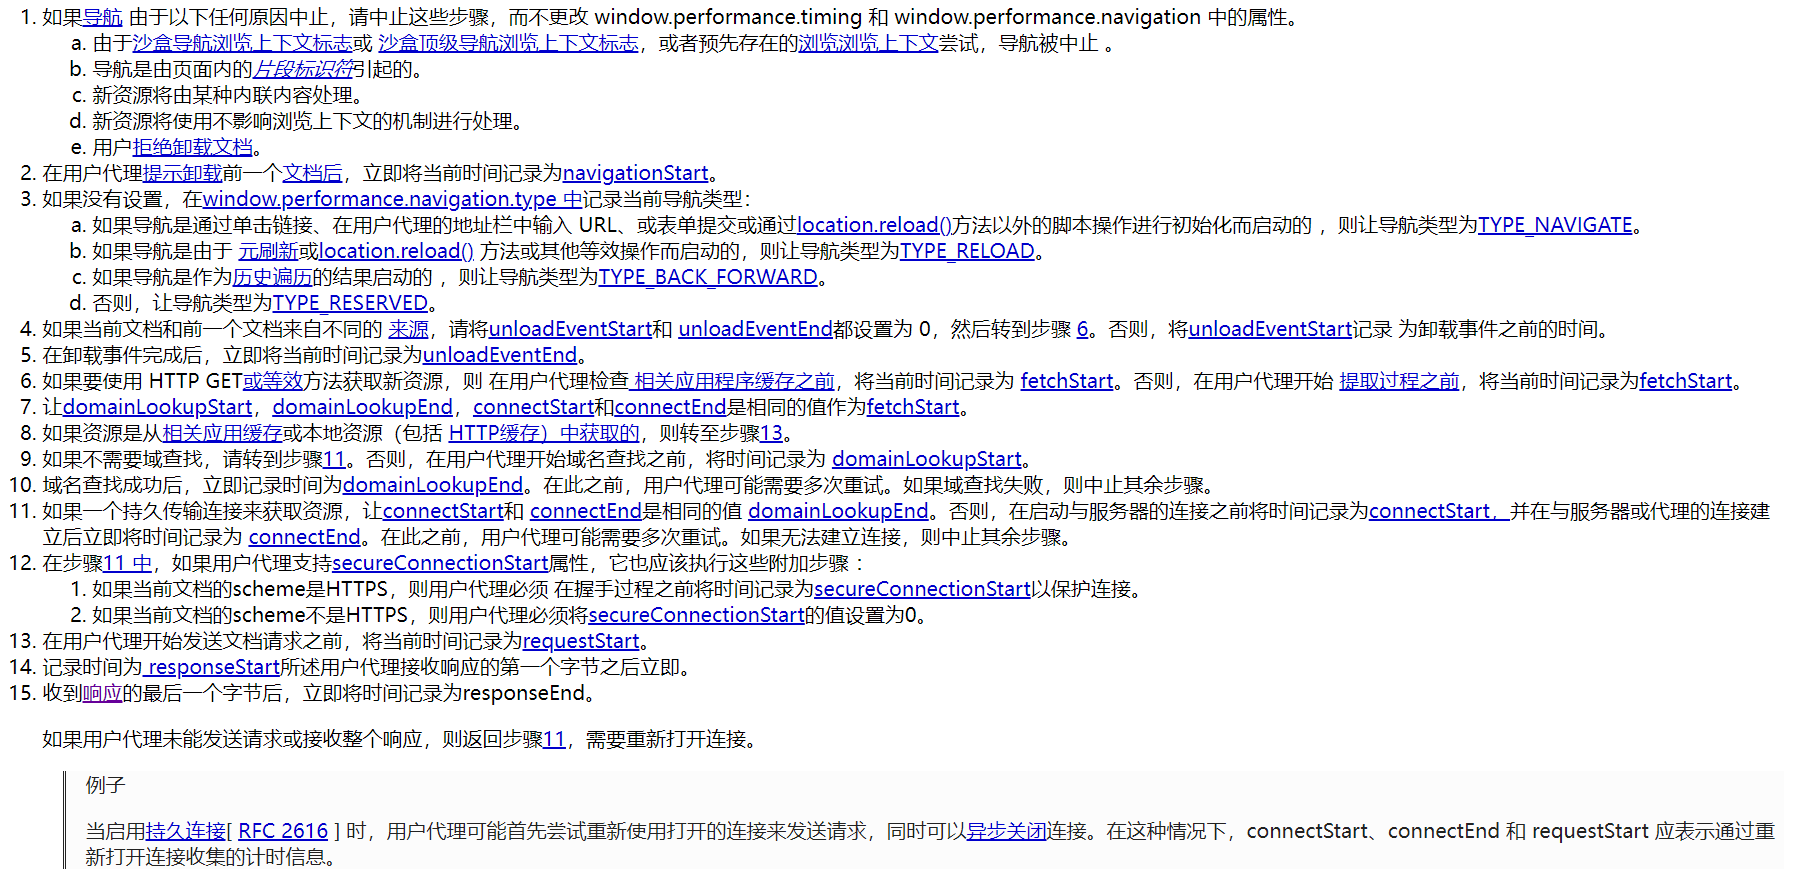
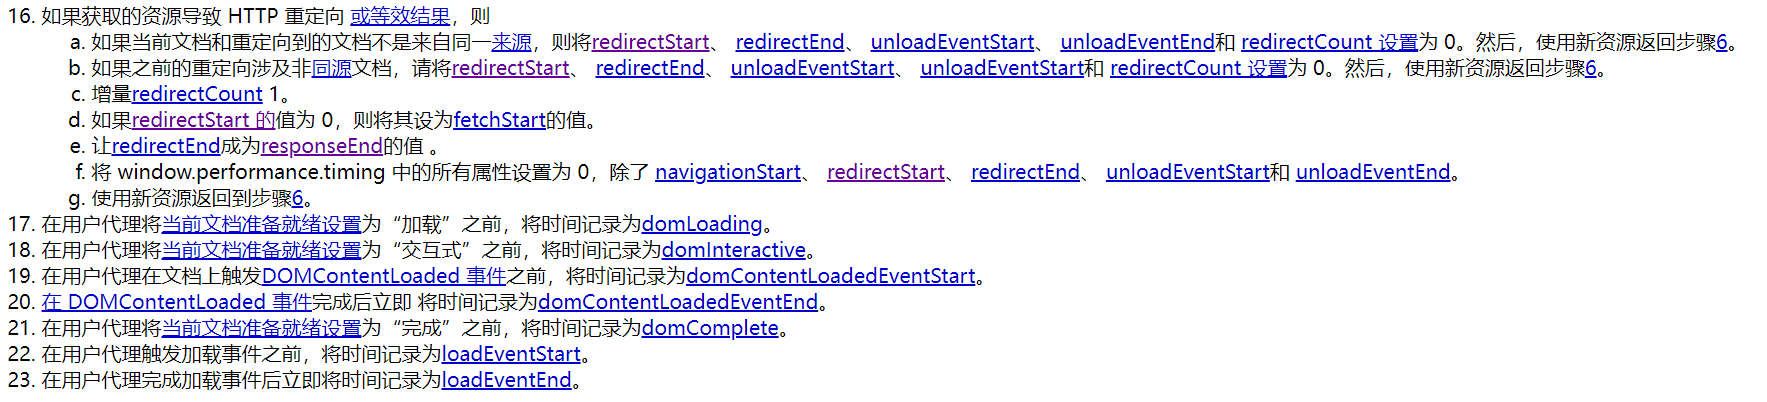
下图分别说明了[PerformanceTiming](https://www.w3.org/TR/navigation-timing/#performancetiming)接口和[PerformanceNavigation](https://www.w3.org/TR/navigation-timing/#performancenavigation)有或没有重定向的 接口定义的时序属性 。
| 时间段 | 描述 |
|---|---|
| navigationStart ~ unloadEventEnd | 上一页面的卸载耗时 |
| fetchStart ~ domainLookupStart | 查询 app DNS 缓存耗时 |
| domainLookupStart ~ domainLookupEnd | dns 查询耗时 |
| connectStart ~ connectEnd | TCP 连接耗时 |
| connectEnd ~ secureConnectionStart | 针对 https 协议,在 tcp 握手后,传输真正的内容前,建立安全连接的耗时 |
| fetchStart ~ responseStart | TTFB(time to first byte), 即首包时长(从用户代理发出第一个请求开始,到页面读取到第一个字节的耗时)。在一个 web 程序中,用户代理发送的第一个 get 请求一般是 index.html,即接收到这个 html 文件的第一个字节的耗费时间 |
| responseStart ~ responseEnd | 内容响应时长 |
| domLoading ~ domInteractive | dom 解析完成,即 DOM 树构建完成的时长 |
| domContentLoadedEventEnd ~ loadEventStart | 渲染时长,domContentLoaded 表示 DOM,CSSOM 均准备就绪(CSSOM 就绪意味着没有样式表阻止 js 脚本执行),开始构建渲染树 |
| navigationStart ~ domLoading | FPT(first paint time), 即首次渲染时间,或白屏时间,从用户打开页面开始,到第一次渲染出可见元素为止 |
| navigationStart ~ domInteractive | TTI(time to interact),首次可交互时间 |
| fetchStart ~ domContentLoadedEventEnd | html 加载完成时间,此时 DOM 已经解析完成 |
| navigationStart ~ loadEventStart | 页面完全加载完成的时间 |
方法
api简单使用
//以一个标志开始。performance.mark("measure-start");//等待一些时间。setTimeout(function(){//标志时间的结束。performance.mark("measure-end");//测量两个不同的标志。performance.measure("measure-list", "measure-start","measure-end");let markArr = performance.getEntriesByName("measure-list");console.log(markArr);//获取所有的测量输出。//在这个例子中只有一个。var measure = markArr[0];console.log("setTimeout milliseconds:",measure);//清除存储的标志位performance.clearMarks();performance.clearMeasures();},1000);
其他
除此之外,在chrome浏览器上有Performance图形化界面,还有Lighthouse也可以提供资源效率的检测
参考文献
https://www.w3.org/TR/navigation-timing/

若有收获,就点个赞吧
0 人点赞
