一、简 介
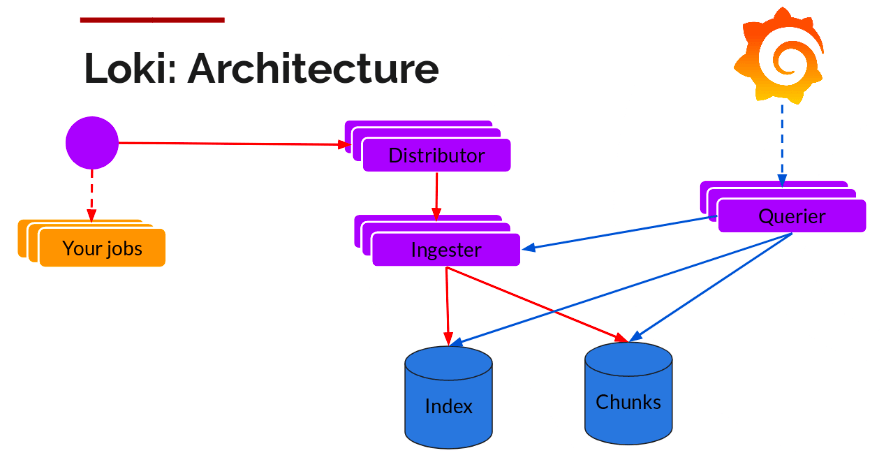
Loki是受Prometheus启发由Grafana Labs团队开源的水平可扩展,高度可用的多租户日志聚合系统。 开发语言: Google Go。它的设计具有很高的成本效益,并且易于操作。使用标签来作为索引,而不是对全文进行检索,也就是说,你通过这些标签既可以查询日志的内容也可以查询到监控的数据签,极大地降低了日志索引的存储。系统架构十分简单,由以下3个部分组成 :
Loki 是主服务器,负责存储日志和处理查询 。
promtail 是代理,负责收集日志并将其发送给 loki 。
Grafana 用于 UI 展示。
只要在应用程序服务器上安装promtail来收集日志然后发送给Loki存储,就可以在Grafana UI界面通过添加Loki为数据源进行日志查询(如果Loki服务器性能不够,可以部署多个Loki进行存储及查询)。作为一个日志系统不光只有查询分析日志的能力,还能对日志进行监控和报警。
Loki文档网址:https://grafana.com/docs/loki/latest/
下载网址:https://github.com/grafana/loki/releases
与 ELK 比 较优势
ELK虽然功能丰富,但规模复杂,资源占用高,操作苦难,很多功能往往用不上,有点杀鸡用牛刀的感觉。
loki 不对日志进行全文索引。通过存储压缩非结构化日志和索引元数据,Loki 操作起来会更简单,更省成本。
通过使用与 Prometheus 相同的标签记录流对日志进行索引和分组,这使得日志的扩展和操作效率更高。
安装部署简单快速,且受 Grafana 原生支持。
下载(这个版本可用)
curl -O -L "https://github.com/grafana/loki/releases/download/v1.5.0/loki-linux-amd64.zip"curl -O -L "https://github.com/grafana/loki/releases/download/v1.5.0/promtail-linux-amd64.zip"wget https://dl.grafana.com/oss/release/grafana-7.1.0-1.x86_64.rpm
安装loki和grafana
loki和grafana部署在一个机器上,可以理解为server端 promtail作为采集工具,可以放在一起,也可以不在该服务器部署
loki
mkdir /datamkdir /data/lokimkdir /data/loki/{chunks,index,wal}
auth_enabled: falseserver:http_listen_port: 3100grpc_listen_port: 9096ingester:wal:enabled: truedir: /data/loki/wallifecycler:address: 127.0.0.1ring:kvstore:store: inmemoryreplication_factor: 1final_sleep: 0schunk_idle_period: 1h # Any chunk not receiving new logs in this time will be flushedmax_chunk_age: 1h # All chunks will be flushed when they hit this age, default is 1hchunk_target_size: 1048576 # Loki will attempt to build chunks up to 1.5MB, flushing first if chunk_idle_period or max_chunk_age is reached firstchunk_retain_period: 30s # Must be greater than index read cache TTL if using an index cache (Default index read cache TTL is 5m)max_transfer_retries: 0 # Chunk transfers disabledschema_config:configs:- from: 2020-10-24store: boltdb-shipperobject_store: filesystemschema: v11index:prefix: index_period: 24hstorage_config:boltdb_shipper:active_index_directory: /data/loki/boltdb-shipper-activecache_location: /data/loki/boltdb-shipper-cachecache_ttl: 24h # Can be increased for faster performance over longer query periods, uses more disk spaceshared_store: filesystemfilesystem:directory: /data/loki/chunkscompactor:working_directory: /data/loki/boltdb-shipper-compactorshared_store: filesystemlimits_config:reject_old_samples: truereject_old_samples_max_age: 168hchunk_store_config:max_look_back_period: 0stable_manager:retention_deletes_enabled: falseretention_period: 0sruler:storage:type: locallocal:directory: /data/loki/rulesrule_path: /data/loki/rules-tempalertmanager_url: http://localhost:9093ring:kvstore:store: inmemoryenable_api: true
启动loki
nohup ./loki-linux-amd64 -config.file=./config.yaml >./loki.log 2>&1 &
Grafana
本次部署使用Docker容器部署
docker pull grafana/grafanadocker run -d -p 3000:3000 --name grafana --restart=always grafana/grafana
promtail
mkdir /opt/promtailunzip promtail-linux-amd64.zipvim promtail.yaml------------------------server:http_listen_port: 9080grpc_listen_port: 0positions:filename: /var/log/positions.yaml # This location needs to be writeable by promtail.client:url: http://localhost:3100/loki/api/v1/pushscrape_configs:- job_name: systempipeline_stages:static_configs:- targets:- 10.10.10.11labels:job: system_loghost: 10.10.10.11__path__: /var/log/*log
启动
nohup ./promtail-linux-amd64 -config.file=./promtail.yaml > ./promtail.log 2>&1 &
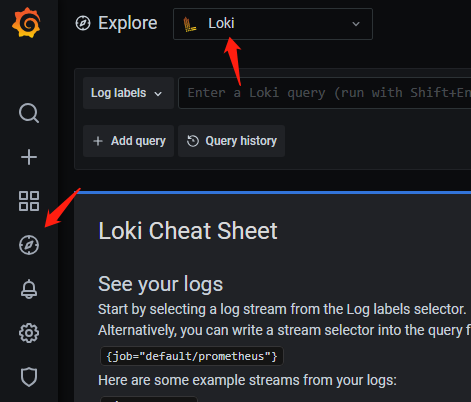
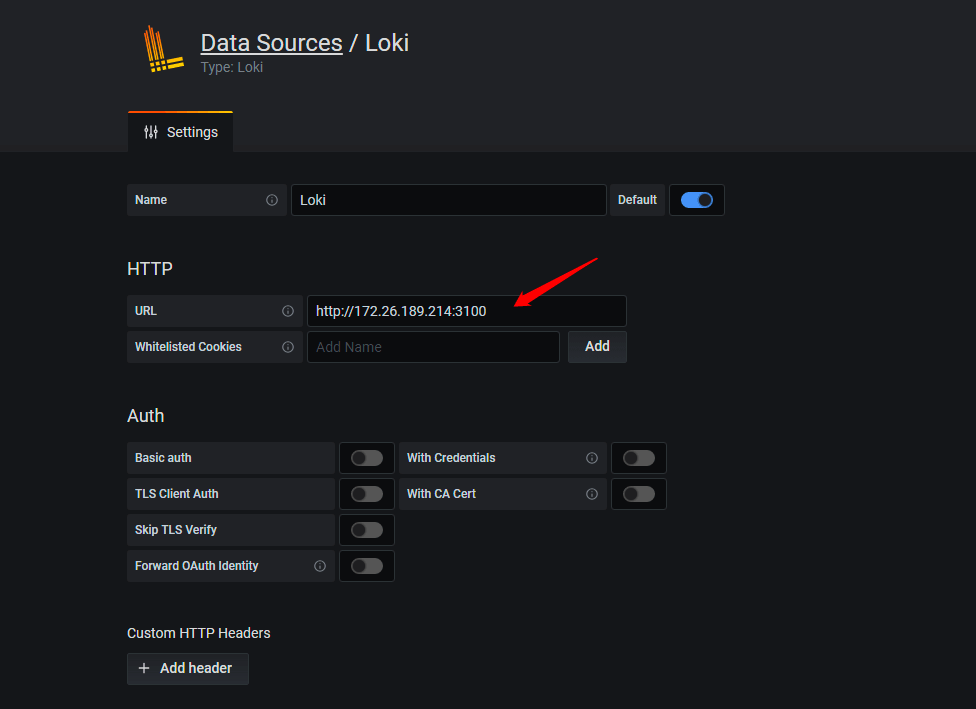
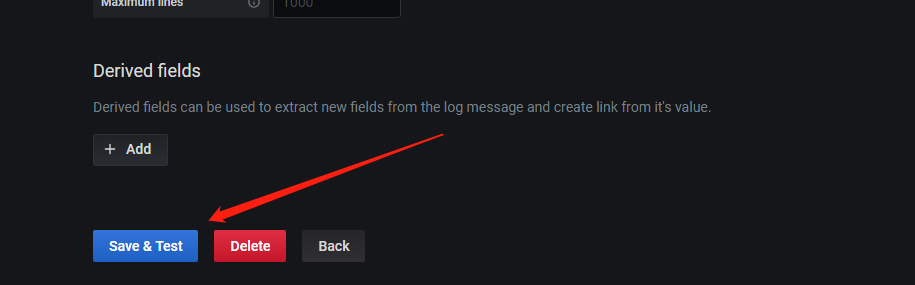
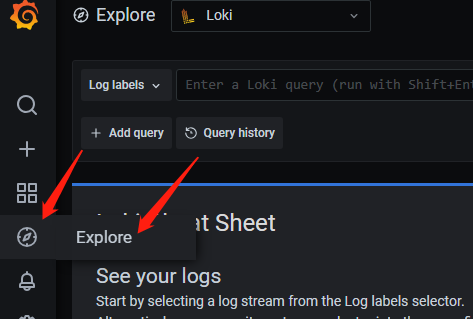
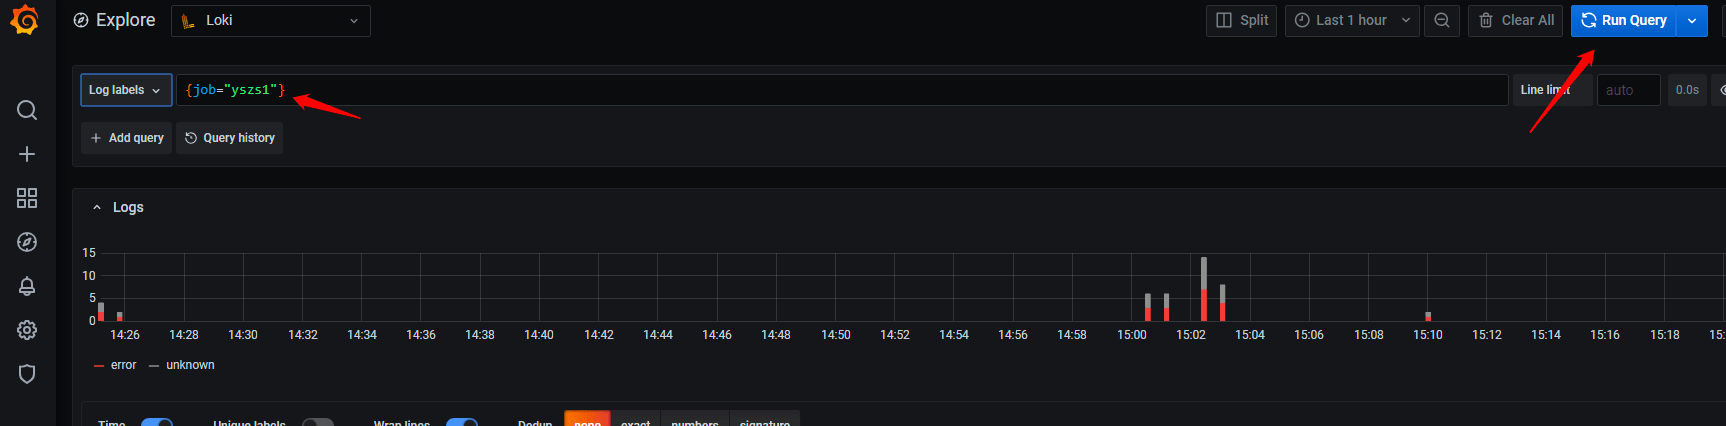
配置
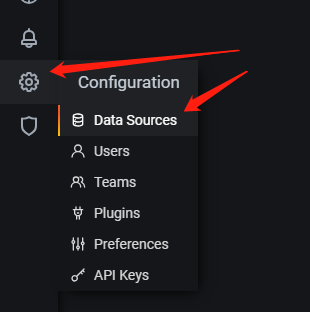
grafana配置 默认账号admin 密码admin
# 查询标签curl -G -s "http://localhost:3100/loki/api/v1/labels" | jqcurl -G -s "http://localhost:3100/loki/api/v1/labels" | jq .data[]
# 根据标签查询对应标签值curl -G -s http://localhost:3100/loki/api/v1/label/<name>/values | jqcurl -G -s "http://localhost:3100/loki/api/v1/label/app_kubernetes_io_instance/values" | jq .data[]

若有收获,就点个赞吧
0 人点赞
