好看的皮囊千篇一律,有趣的灵魂两百多斤。
和Word、Excel承载数据的能力相比,PPT的应用重点在于表演。
比如一场发布会、一场演说、一次产品展示、一次客户沟通……
正常情况下,用PowerPoint等软件制作PPT是明智的选择,简单实用。
但如果需要批量或者自动化处理PPT文件时,用Python就能节省很多时间。
比如:
- 用PPT批量生成一些发布会风格的图片
- 从大量PPT中提取表格数据
- 用PPT批量制作简单动画
处理PPT的Python库,主要有两类:
pywin32,调用操作系统上已装好的PPT软件。python-pptx,根据OpenXML规范解析XML文件。
日常处理推荐使用python-pptx模块,它基于PIL处理图片,基于xlsxwriter处理图表。
但如果需要批量转换PPT文件格式,如导出成PDF,那就得用pywin32,而且只能在Windows操作系统上操作。
本文主要介绍python-pptx用法,模块安装:pip install python-pptx。
注意:python-pptx暂时还不支持SmartArt和动画。如果需要批量生成,就得自己操作XML文件中对应内容。
基本使用
PPT中基本元素包括:
- slide(幻灯片):一个PPT由一系列slide构成。
- slide_master(幻灯片母版):母版可定义主题样式基准。
- slide_layouts(模版):创建幻灯片时可选择的模版。
- shape(形状):包含一切可视元素,通过
slide.shapes可访问slide内元素。 - placeholder(占位符):在模板中占据位置,如图片、文字等。
- paragraph(段落):文本段,可以直接设置整段文本样式。
- text(文本):段落内的文本,通过
paragraph.add_run()生成。
import pathlibfrom pptx import Presentationfrom pptx.enum.dml import MSO_THEME_COLORfrom pptx.util import Inches, Ptpath = list(pathlib.Path.cwd().parents)[1].joinpath('data/automate/005ppt')out_path = path.joinpath('005ppt_basic.pptx')prs = Presentation()# 查看所有布局for lo in prs.slide_layouts:print(lo.name)# 创建标题页title_slide_layout = prs.slide_layouts[0]print(w, h, lo, ma)slide = prs.slides.add_slide(title_slide_layout)title = slide.shapes.titlesubtitle = slide.placeholders[1]title.text = '只差一个程序员了'subtitle.text = '程一初'# 设置背景色fill = slide.shapes[0].fillfill.solid()fill.fore_color.theme_color = MSO_THEME_COLOR.ACCENT_1fill.fore_color.brightness = -0.25# 创建第一页内容bullet_slide_layout = prs.slide_layouts[1]slide = prs.slides.add_slide(bullet_slide_layout)shapes = slide.shapestitle_shape = shapes.titlebody_shape = shapes.placeholders[1]title_shape.text = 'Python1024'tf = body_shape.text_frametf.text = '第一级内容'p = tf.add_paragraph()p.text = '第一级段落内容'p.level = 1p = tf.add_paragraph()p.text = '第二级段落内容'p.level = 2run = p.add_run()# 与`python-docx`里的用法类似,但内容设置在`text`中run.text = '自定义字体'run.font.name = '微软雅黑'run.font.size = Pt(25)run.font.bold = Trueprint(tf.paragraphs[0].text)# 从一个空白页开始创建内容blank_slide_layout = prs.slide_layouts[6]slide = prs.slides.add_slide(blank_slide_layout)left = top = width = height = Inches(1)txt_box = slide.shapes.add_textbox(left, top, width, height)tf = txt_box.text_frametf.text = '文本框内容'p = tf.add_paragraph()p.text = '文本框内增加一个粗体段落'p.font.bold = Truep = tf.add_paragraph()p.text = '文本框内增加一个大字体段落'p.font.size = Pt(40)prs.save(out_path)
图片和图形
PPT中图相关元素有3类:
- picture:图像,单位是Inch
- autoshape:形状,如流程图
- chart:图表,如直方图、饼图
生成流程图
import pathlibfrom pptx import Presentationfrom pptx.util import Inches, Ptfrom pptx.enum.shapes import MSO_SHAPEpath = list(pathlib.Path.cwd().parents)[1].joinpath('data/automate/005ppt')out_path = path.joinpath('005ppt_image.pptx')img_path = path.joinpath('image.jpg')prs = Presentation()blank_slide_layout = prs.slide_layouts[6]slide = prs.slides.add_slide(blank_slide_layout)# 增加两张图片,一大一小left = top = Inches(1)pic = slide.shapes.add_picture(str(img_path), left, top)left = Inches(6)height = Inches(3)pic = slide.shapes.add_picture(str(img_path), left, top, height=height)# 增加一个AutoShape流程图title_only_slide_layout = prs.slide_layouts[5]slide = prs.slides.add_slide(title_only_slide_layout)shapes = slide.shapesshapes.title.text = '流程图'left = Inches(0.93) # 0.93" centers this overall set of shapestop = Inches(3.0)width = Inches(1.75)height = Inches(1.0)shape = shapes.add_shape(MSO_SHAPE.PENTAGON, left, top, width, height)shape.text = '第一步'left = left + width - Inches(0.4)# 第一个形状左边平,第二个开始,左边有尖角,需要更长width = Inches(2.0)for n in range(2, 6):shape = shapes.add_shape(MSO_SHAPE.CHEVRON, left, top, width, height)shape.text = f'第{n}步'left = left + width - Inches(0.4)prs.save(out_path)
生成图表
import pathlibfrom pptx import Presentationfrom pptx.util import Inches, Ptfrom pptx.chart.data import CategoryChartDatafrom pptx.enum.chart import XL_CHART_TYPE, XL_TICK_MARK, XL_LABEL_POSITION, XL_LEGEND_POSITIONfrom pptx.dml.color import RGBColorpath = list(pathlib.Path.cwd().parents)[1].joinpath('data/automate/005ppt')out_path = path.joinpath('005ppt_chart.pptx')prs = Presentation()blank_slide_layout = prs.slide_layouts[6]slide = prs.slides.add_slide(blank_slide_layout)# 增加一个图表chart_data = CategoryChartData()chart_data.categories = ['A销售额', 'B销售额', 'C销售额']chart_data.add_series('Q1销售', (100, 120, 200))chart_data.add_series('Q2销售', (120, 150, 180))chart_data.add_series('Q3销售', (150, 180, 120))chart_data.add_series('Q4销售', (130, 210, 150))x, y, cx, cy = Inches(2), Inches(2), Inches(6), Inches(4)chart = slide.shapes.add_chart(XL_CHART_TYPE.COLUMN_CLUSTERED, x, y, cx, cy, chart_data).chart# 设置图表的轴信息category_axis = chart.category_axiscategory_axis.has_major_gridlines = Truecategory_axis.minor_tick_mark = XL_TICK_MARK.OUTSIDEcategory_axis.tick_labels.font.italic = Truecategory_axis.tick_labels.font.size = Pt(24)plot = chart.plots[0] # 用Plot对象访问标签plot.has_data_labels = Truedata_labels = plot.data_labelsdata_labels.font.size = Pt(13)data_labels.font.color.rgb = RGBColor(0x0A, 0x42, 0x80)data_labels.position = XL_LABEL_POSITION.INSIDE_ENDchart.has_legend = Truechart.legend.position = XL_LEGEND_POSITION.RIGHTchart.legend.include_in_layout = False# 增加一个饼图slide = prs.slides.add_slide(blank_slide_layout)chart_data = CategoryChartData()chart_data.categories = ['A销售额', 'B销售额', 'C销售额']chart_data.add_series('年度销售比', (0.276, 0.365, 0.359))chart = slide.shapes.add_chart(XL_CHART_TYPE.PIE, x, y, cx, cy, chart_data).chartchart.has_legend = Truechart.legend.position = XL_LEGEND_POSITION.BOTTOMchart.legend.include_in_layout = Falsechart.plots[0].has_data_labels = Truedata_labels = chart.plots[0].data_labelsdata_labels.number_format = '0%'data_labels.position = XL_LABEL_POSITION.OUTSIDE_ENDprs.save(out_path)
注意,关于图形类的处理,python-pptx模块暂不支持下面两种场景:
SmartArt,微软并没有公开发布过其标准格式,目前只有PowerPoint软件具备这个功能。- PPT文件按页导出成图片,这也是PowerPoint软件功能,在Windows上可以借助
win32com等模块调用PPT软件功能实现。
生成数据表格
PPT中也可以插入表格,只不过表格功能非常有限,仅用于展示。
在自动生成PPT时,有时候需要把外部数据复制到PPT内,可以读取数据后在PPT中插入表格。
比如:
import pathlibfrom pptx import Presentationfrom pptx.util import Inchespath = list(pathlib.Path.cwd().parents)[1].joinpath('data/automate/005ppt')out_path = path.joinpath('005ppt_table.pptx')prs = Presentation()title_only_slide_layout = prs.slide_layouts[5]slide = prs.slides.add_slide(title_only_slide_layout)shapes = slide.shapesshapes.title.text = '表格数据'rows, cols = 5, 4left = top = Inches(2.0)width = Inches(6.0)height = Inches(0.8)table = shapes.add_table(rows, cols, left, top, width, height).tabledata = [('季度', 'A销售', 'B销售', 'C销售'), # 表头('Q1', 100, 120, 200),('Q2', 120, 150, 180),('Q3', 150, 180, 120),('Q4', 130, 210, 150),]for col in table.columns:col.width = Inches(1.6)table.columns[0].width = Inches(1.0)for i, d in enumerate(data):for j in range(4):table.cell(i, j).text = str(data[i][j])prs.save(out_path)
导出素材和数据
导出图片和幻灯片备注
之前说过,想提取docx、xlsx、pptx文件里的图片素材,可以先把文件解压缩,然后到对应目录查看图片。其中pptx文件解压后,图片在ppt/media文件夹内。
当然,也可以通过Python自动导出。
import pathlibfrom pptx import Presentationfrom pptx.util import Inches, Ptfrom pptx.enum.shapes import MSO_SHAPE_TYPE# 借用openpyxl的单位转换from openpyxl.utils.units import EMU_to_pixels as e2ppath = list(pathlib.Path.cwd().parents)[1].joinpath('data/automate/005ppt')img_out_path = path.joinpath('005ppt_out_images')txt_out_path = path.joinpath('005ppt_notes.txt')in_path = path.joinpath('input_covid19.pptx')prs = Presentation(in_path)# EMU单位,1 Pixel = 9525 EMUw, h = prs.slide_width, prs.slide_heightprint(f'总共 {len(prs.slides)} 页,页宽 {e2p(w)} px,页高 {e2p(h)} px')cnt_img, txt_list = 0, []for i, slide in enumerate(prs.slides):# 提取notesnotes_slide = slide.notes_slidetext_frame = notes_slide.notes_text_frametxt_list.append(f'第 {i} 页:')txt_list.append(text_frame.text)# 提取图片for s in slide.shapes:if s.shape_type == MSO_SHAPE_TYPE.PICTURE:img = s.imagecnt_img += 1ext = img.content_type.split('/')[1]f_out_path = img_out_path.joinpath(f'{cnt_img}.{ext}')with open(f_out_path, 'wb') as f:f.write(img.blob)print(f'总导出 {cnt_img} 张图片.')with open(txt_out_path, 'w') as txt_fout:txt_fout.write('\n'.join(txt_list))
导出表格和及图表中的数据
从上面导出图片的过程可以看到,想要导出一个元素,关键是识别出它的类型。
所以,导出表格和图表的关键在于:识别出table和chart。
另外,有2个注意点:
table的数据可以直接获取,但注意python-pptx中表格索引从0开始(openpyxl从1开始)chart的数据在其内部,需要通过plots.categories提取
import pathlibfrom pptx import Presentationfrom pptx.chart.data import CategoryChartDatafrom pptx.util import Inches, Ptfrom pptx.enum.shapes import MSO_SHAPE_TYPEfrom openpyxl.utils.units import EMU_to_pixels as e2pfrom openpyxl import Workbookpath = list(pathlib.Path.cwd().parents)[1].joinpath('data/automate/005ppt')table_out_path = path.joinpath('005ppt_out_tables.xlsx')chart_data_out_path = path.joinpath('005ppt_out_chart_data.xlsx')chart_out_path = path.joinpath('005ppt_out_charts')in_path = path.joinpath('input_table.pptx')prs = Presentation(in_path)# EMU单位,1 Pixel = 9525 EMUw, h = prs.slide_width, prs.slide_heightprint(f'总共 {len(prs.slides)} 页,页宽 {e2p(w)} px,页高 {e2p(h)} px')cnt_tables, cnt_charts = 0, 0xlsx_wb = Workbook()chart_wb = Workbook()for i, slide in enumerate(prs.slides, start=1):for j, s in enumerate(slide.shapes, start=1):if s.shape_type == MSO_SHAPE_TYPE.TABLE and s.has_table:cnt_tables += 1tbl = s.tablecnt_row, cnt_col = len(tbl.rows), len(tbl.columns)print(f'增加表格 {cnt_tables}: {cnt_row} x {cnt_col}')ws = xlsx_wb.create_sheet(f'{cnt_tables}_page_{i}')for r in range(cnt_row):for c in range(cnt_col):cell = tbl.cell(r,c)text_runs = []for paragraph in cell.text_frame.paragraphs:for run in paragraph.runs:text_runs.append(run.text)ws.cell(row=r+1, column=c+1, value=''.join(text_runs))elif s.shape_type == MSO_SHAPE_TYPE.CHART:chart = s.chartcnt_charts += 1# 导出Chart的数据到表格data = chart.series# for plot in chart.plots:# cat = list(plot.categories)cat = list(chart.plots[0].categories) # 假设1个图表if len(data) > 0:ws = chart_wb.create_sheet(f'{cnt_charts}_page_{i}')print(f'增加Chart数据 {cnt_charts}: {len(data)}行, {len(cat)} 列')cat = ['标签'] + catws.append(cat)for d in data:values = [d.name] + list(d.values)ws.append(values)xlsx_wb.save(table_out_path)chart_wb.save(chart_data_out_path)
总结
本文重点介绍了python-pptx的使用方法,包括基本文件读写、图形图像处理,以及表格图表内部数据的抽取等。
虽然PPT能装载的数据有限,但它的表达能力丰富,关键是看怎样应用。不同的配色、布局、形状、内容,会产生完全不同的效果。
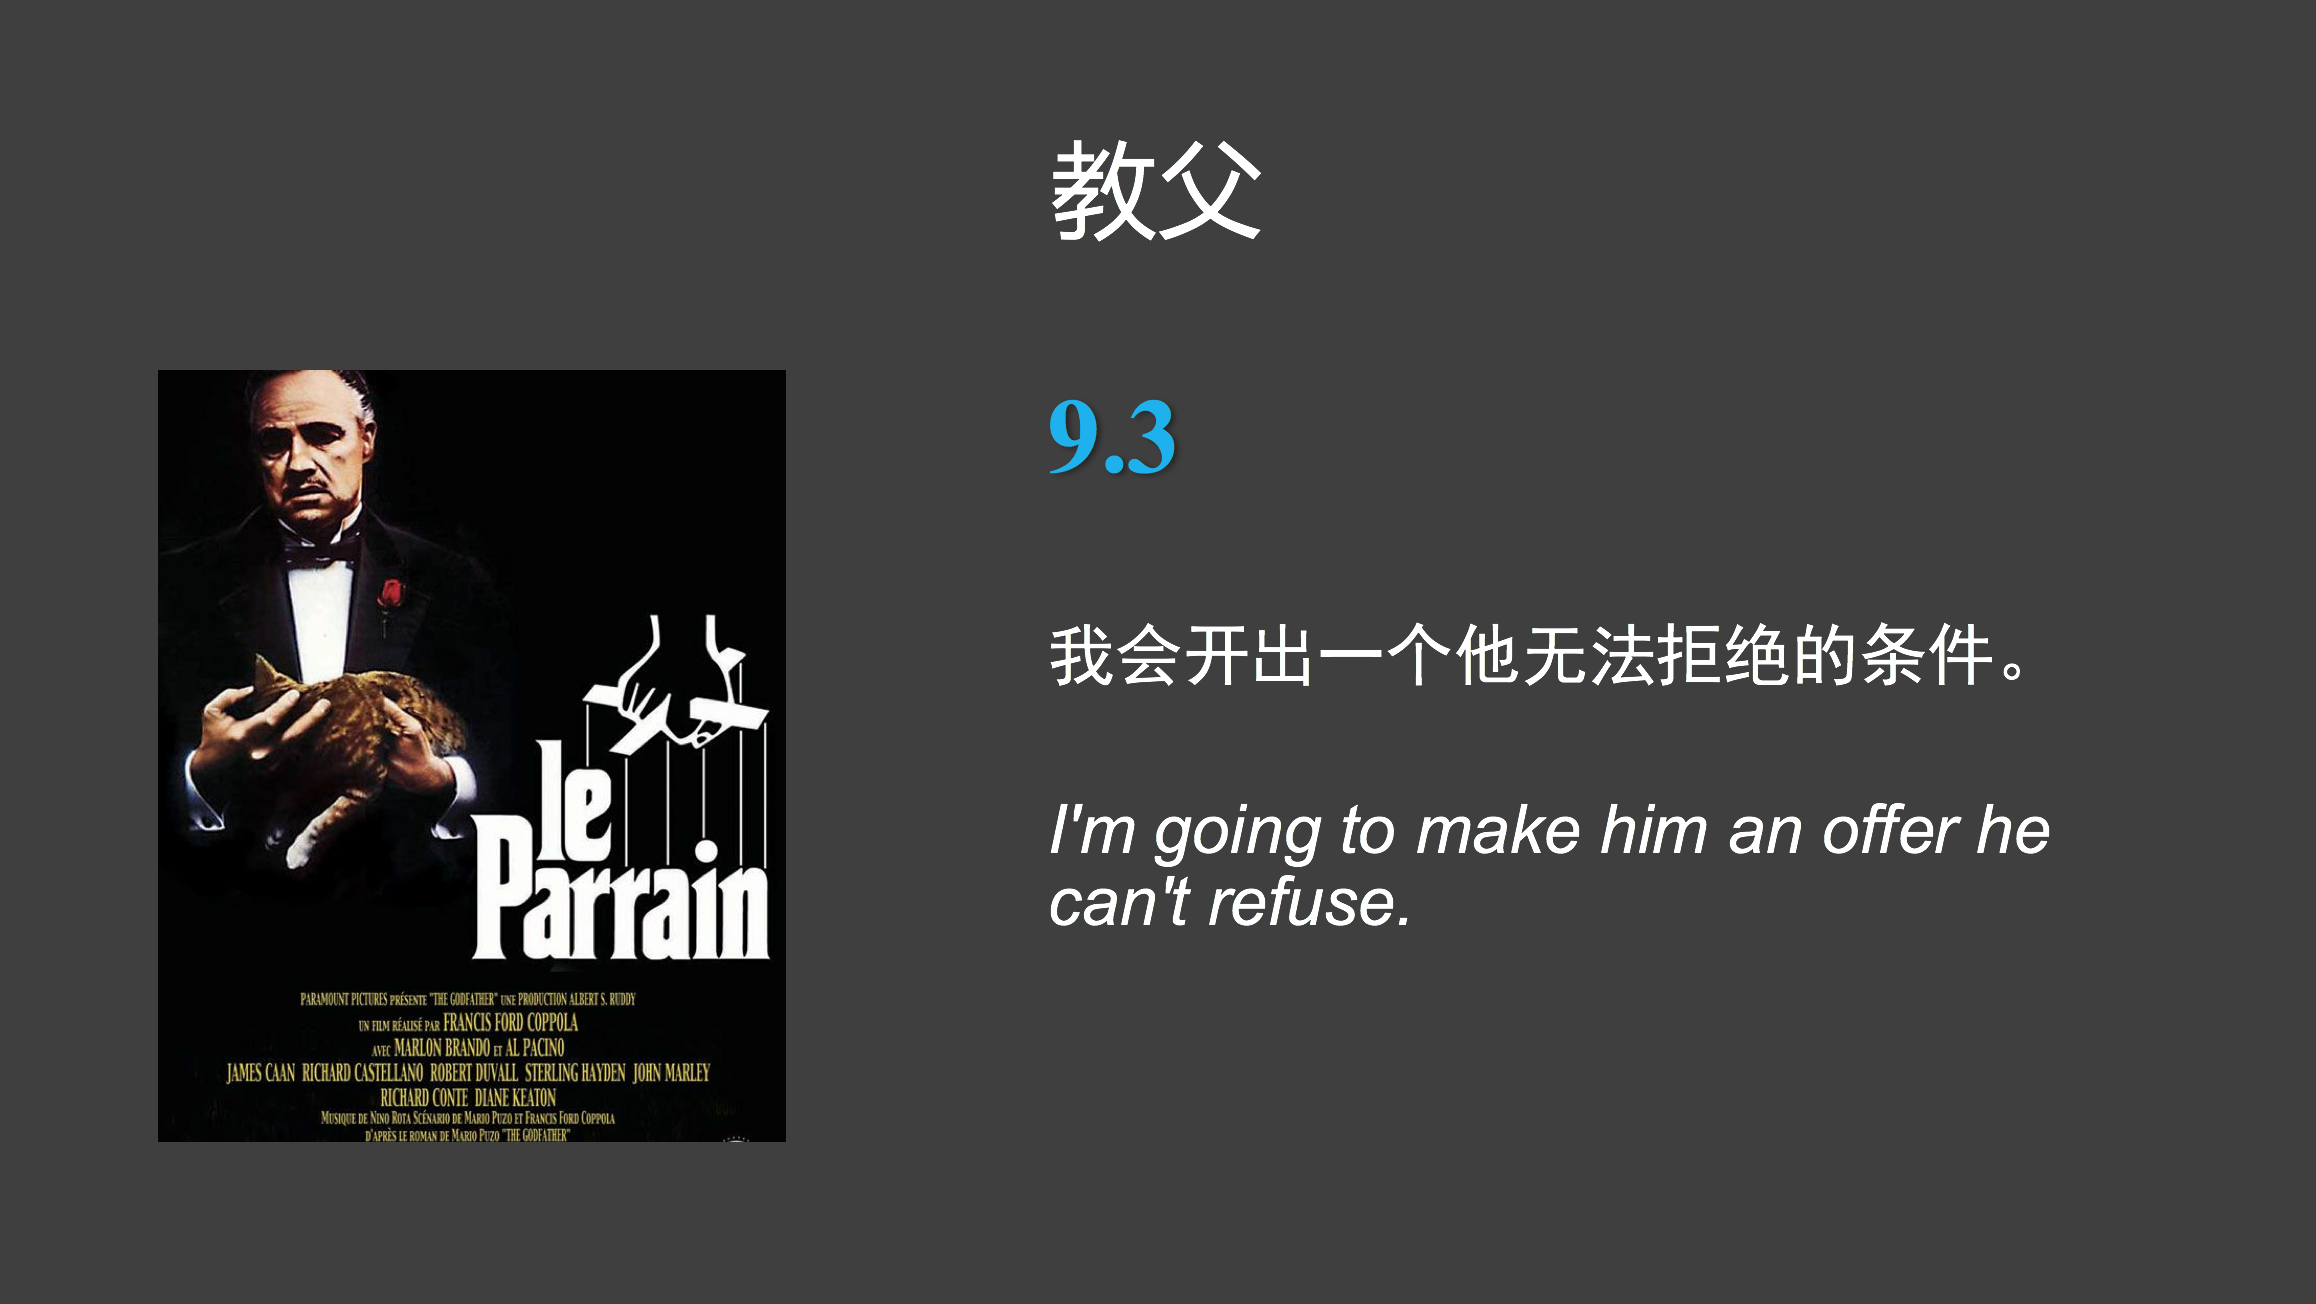
最后,可以尝试下用PPT制作海报卡片,在PPT中批量生成slide是件容易的事,再打开软件导出图片即可。比如把豆瓣上的高分电影,随机配上金句文案:

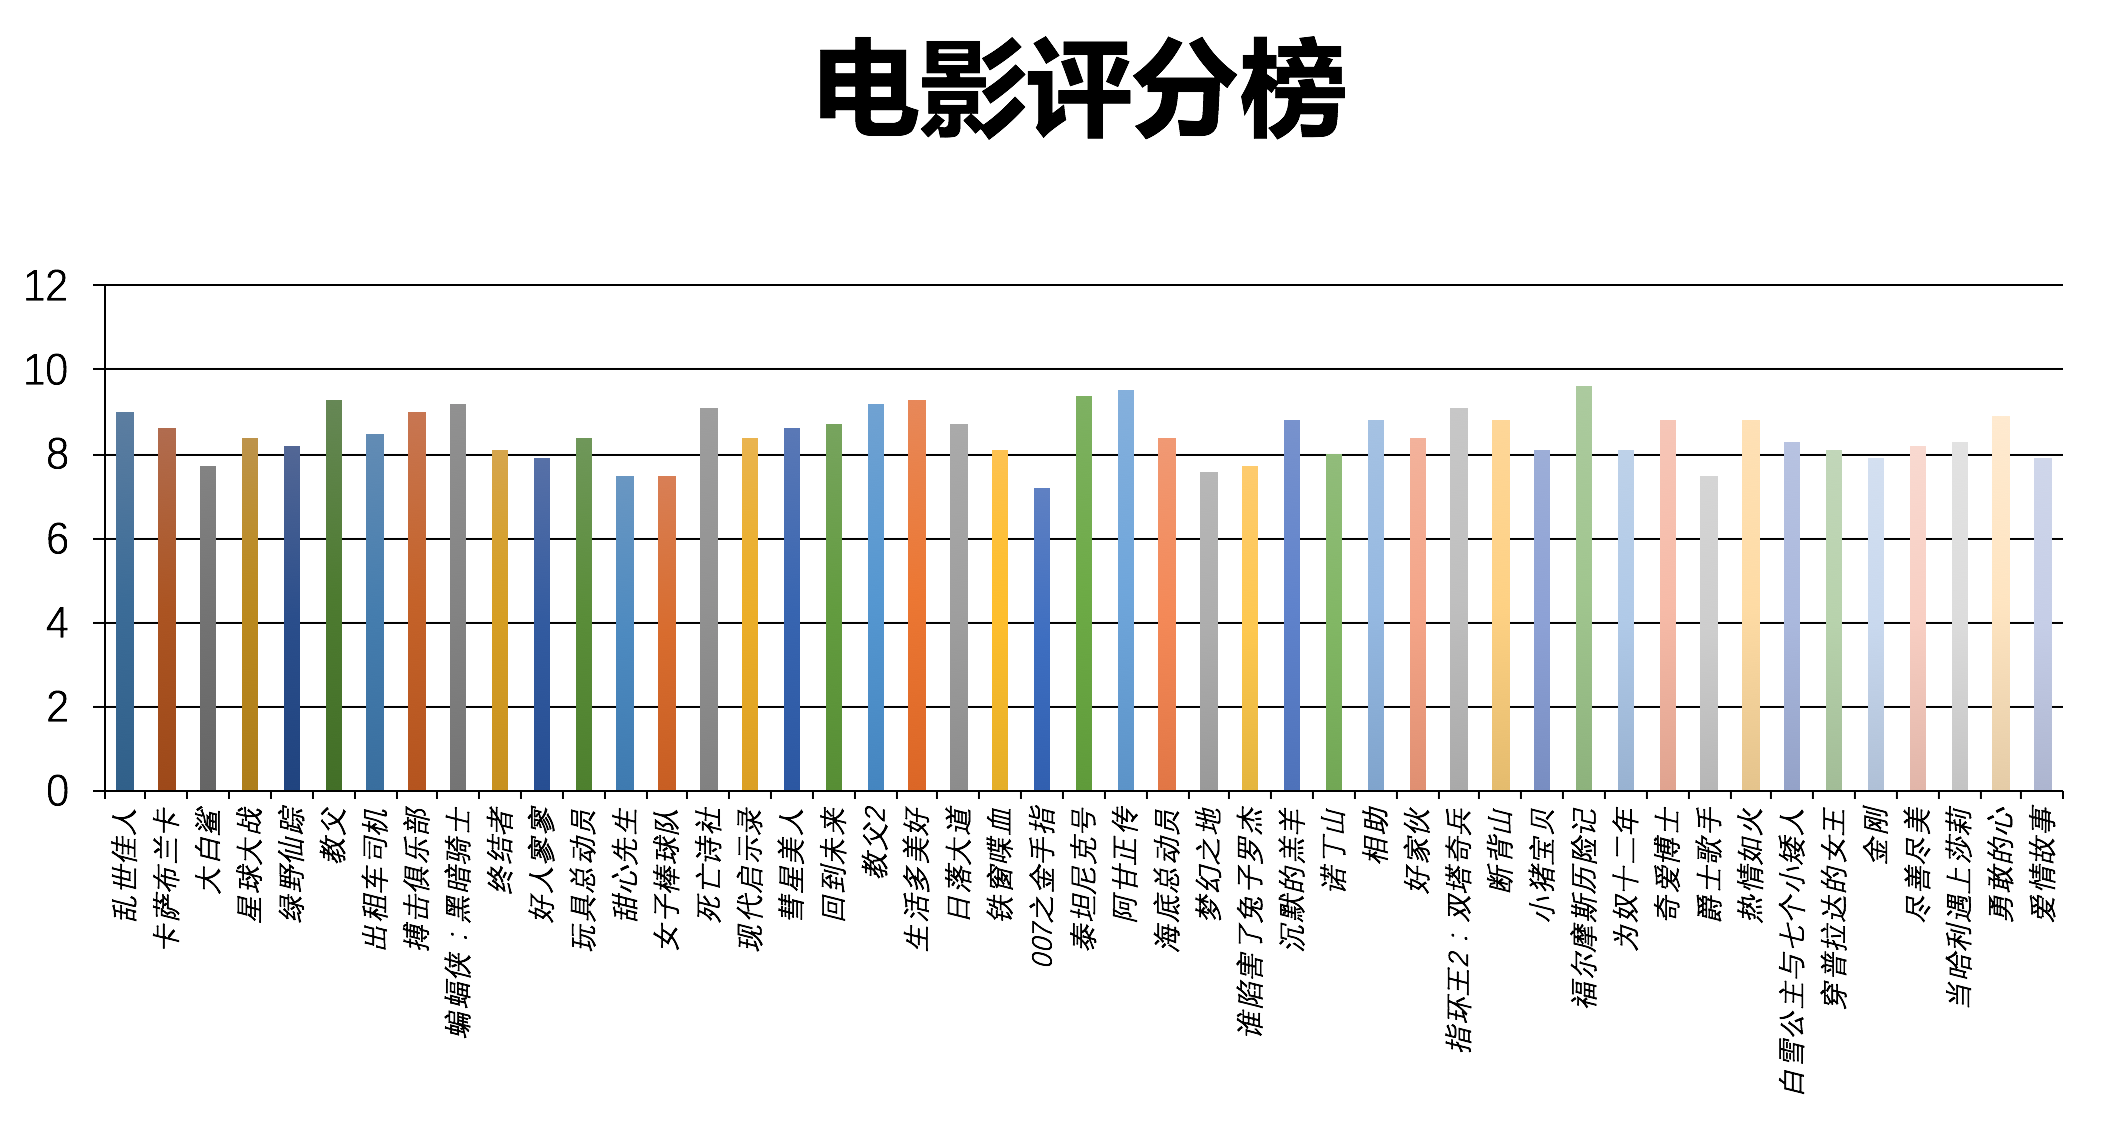
顺便再生成一个电影评分榜。
加入学习群

若有收获,就点个赞吧
0 人点赞
