Matplotlib的子图subplot的使用 - 简书
更多的图可以参考:https://matplotlib.org/gallery/index.html,这里有很完善的图和代码。
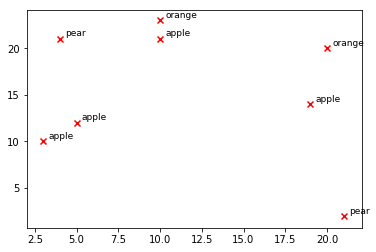
散点图
import matplotlib.pyplot as plt# simulating a pandas df['type'] columntypes = ['apple', 'orange', 'apple', 'pear', 'apple', 'orange', 'apple', 'pear']x_coords = [10, 10, 5, 4, 3, 20, 19, 21]y_coords = [21, 23, 12, 21, 10, 20, 14, 2]for i,type in enumerate(types):x = x_coords[i]y = y_coords[i]plt.scatter(x, y, marker='x', color='red')plt.text(x+0.3, y+0.3, type, fontsize=9)plt.show()

若有收获,就点个赞吧
0 人点赞
