Chrome Debugging Android Applications
Note that this document only applies to 5+App applications.
HBuilder has three ways to debug the front-end code,for example watch while changing, running on real device, and webkit remote debugg on real device. Webkit remote debug is actually an official service provided by Google and Apple. This article mainly introduces how to debug webpages running in webview on Android phones under google’s chrome.
Articles Navigation:
- Method 1 - watch while changing
- Method 2 - running on real device
- Method 3 - webkit remote debugg on real device (Android Phone)
- Method 4 - webkit remote debugg on real device (iOS Phone)
Overview of Chrome debugging Android phones
Debugging is a very important part of the software development process, it can help developers quickly locate and solve the problems encountered in the development process. For the development of HTML5, everyone knows that Chrome’s DevTools tool has powerful functions and friendly user experience. It can not only debug JavaScript quickly and easily, check the DOM structure of HTML pages, update the CSS styles of elements in real time, but also track and analyze page resource loading performance and other issues. For developers of mobile platforms, from Android 4.4, you can also use Chrome’s DevTools to connect the device to debug the application.
The debugging effect is shown in the figure:

Software requirements
- The system version of the Android device or emulator is 4.4+;
Real device debugging environment
If you have an Android device and the system is version 4.4 or higher, you can directly use Chrome to connect for debugging.
Get device version
Open the system “Settings” -> “About” to check the Android version:

The Android version must be 4.4 and above, otherwise application debugging cannot be performed. Please refer to the “Simulator Debugging Environment” chapter to use the simulator for application debugging.
Show developer options
Android device default “Developer Options” is hidden, you need to open the “Settings” -> “About” page, click on the “Version Number” item multiple times (7 times), return to the “Settings” page to display “Developer Options” :

Click “Developer Options” to open the “Developer Options” settings page.
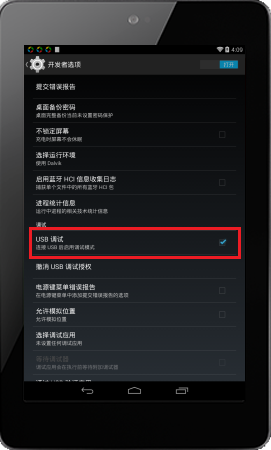
Turn on USB debugging
Connect PC
The Android device is connected to the PC via a USB data cable. If the system cannot recognize it correctly, you need to install the driver, which can usually be downloaded and installed from the official website of the device manufacturer. You can also use third-party mobile assistant software to install, such as “360 mobile assistant”, “app treasure” and so on.
After the PC find the device, you can connect and install the HBuilder application through the real device running function of HBuilder.
Use HBuilder to debug
In the latest version of HBuilder, click the run menu, or the view menu of HBuilderX, and click “Open Webview debugging mode” inside. Make sure that the phone is connected and the debuggable app is activated, then the debuggable pages will be listed on the right or bottom. Click debug/inspect to open the chrome console for debugging.
Note:Since chrome83, the agreement has been adjusted. Since HBuilderX2.8, the new protocol has been adapted. If your chrome is upgraded to version 83 or higher, you need to update HBuilderX to 2.8+
================================================
This is the end of the developer’s reading. The follow-up documents are the installation tutorial of the Android emulator and the tutorial of using chrome to debug without using HBuilder.
================================================
Appendix: Android emulator debugging environment
If you don’t have an Android phone and want to debug Android applications, then you need to install Google’s official Android emulator. Note: Three-party emulators such as genymotion, Droid (Haimawan), Bluestacks and other emulators can only run on real devices, and cannot be debugged.
The following content only introduces the installation of Google’s official emulator. As Google updates frequently, it is recommended that developers follow other updated tutorials on the Internet at any time.
If you do not have a device with Android 4.4 and above, you can configure the Android emulator for debugging. The Android emulator has always been known for its slow running. In fact, the official has provided a solution to use Intel HAXM to accelerate, which greatly improves the running speed of the emulator.
Hardware Requirements
- CPU supports Intel VT technology (AMD CPU cannot use HAXM acceleration);
- Recommended 4G memory
- Window XP/Vista/7/8(32/64-bit),Recommended Windows 7/8(64-bit)。
Network Requirements You have to use VPN for visiting google services. It is necessary to use VPN for emulator during installation, update and debugging initialization. Please try to modify local host configuration if you cannot visit google, host reference to google-hosts)
ADT Tool
To configure the simulator debugging environment, you need to install the ADT tool. If you have already configured the android development environment, you can skip this chapter.
Download ADT Tool
The Android emulator development environment needs to be installed through the ADT tool. There is no need to download the complete ADT Bundle, just use the independent ADT tool:
- Download Android SDK Tools
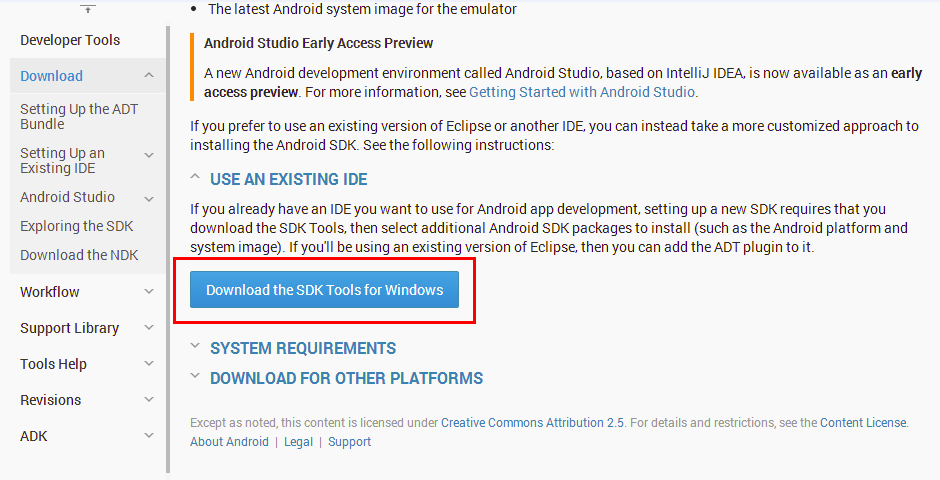
Select the independent ADT plug-in installation package for the windows platform.
- Agree to the terms and conditions
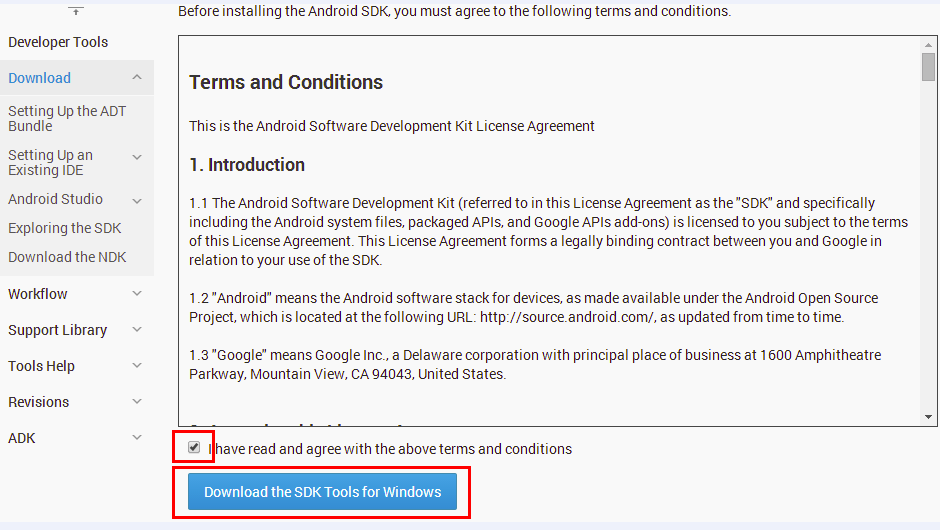
Click download button
- Save Installation The current version is 22.6.2, saved it as::installer_r22.6.2-windows.exe。
Install ADT Tool
- Double-click to run the saved ADT installation file(install_r22.6.2-windows.exe), start to install.
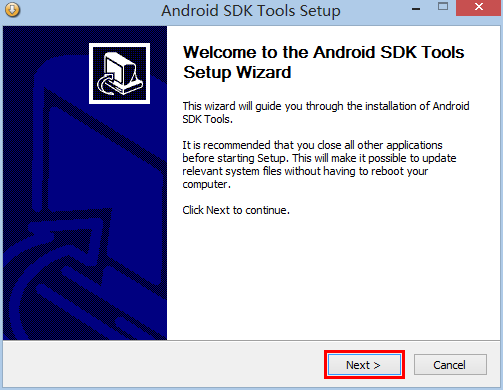
Choose “Next”,
- Configure the JDK environment If you have already installed the JDK environment, you are prompted to confirm:

Click “Next” If you have not installed the JDK, you will be prompted that it was not found:

Set JAVA_HOME environment variable after installing JDK, and re-run the ADT installation file.
- Choose Users

Choose default value “Install just for me”,then click “Next”.
- Choose Install Location
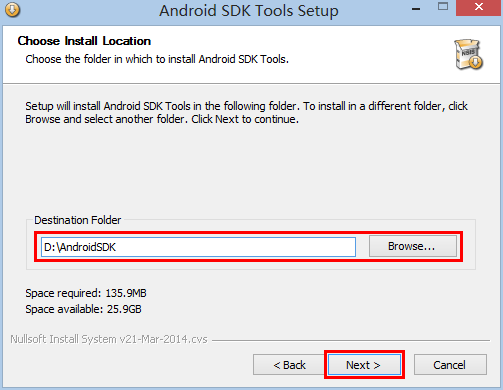
Select non-system disk directory(Such as “D:\AndroidSDK”), ensure that there is enough disk space to install the SDK and emulator files (at least 1G of space is required). Click “Next”.
- Choose Start Menu Folder
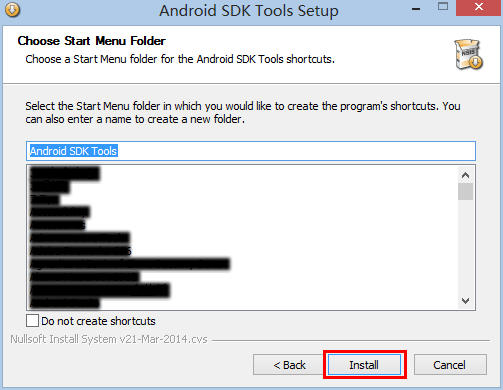
Keep default value, then click “Next”
- Extract and install
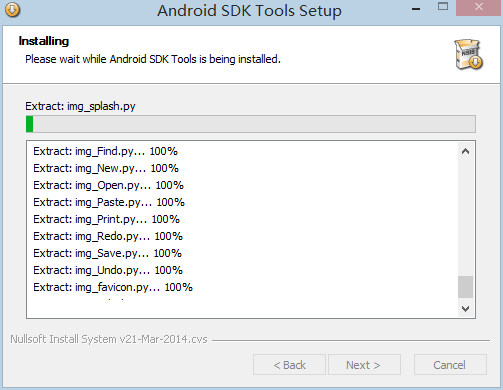
After completion, click “Next”:
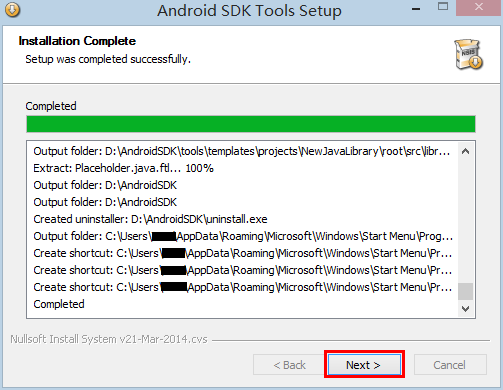
- Installation Complete

Start SDK Manager(Android SDK Manager), click “Next”, complete the installation of the ADT tool. If it does not start immediately, you can double-click to run the “SDK Manager.exe” program in the Android SDK root directory (such as “D:\AndroidSDK”).
Download SDK and emulator
After installing the ADT tool, start the SDK management to manage each version of the compilation tool, SDK, emulator, and plug-ins, such as upgrade, installation, uninstallation, etc. If you have already downloaded the SDK and emulator, you can skip this chapter.
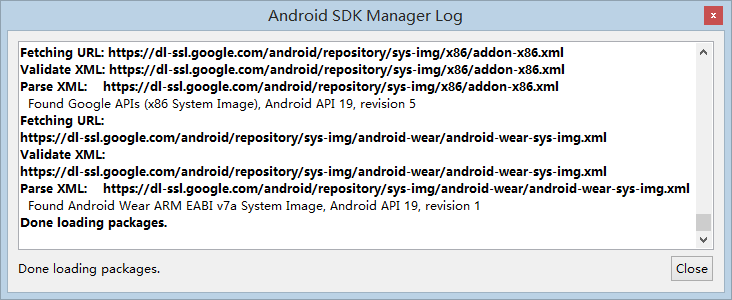
- Update SDK list After starting the SDK management program, the latest tool, SDK, emulator and extension plug-in list will be automatically obtained.
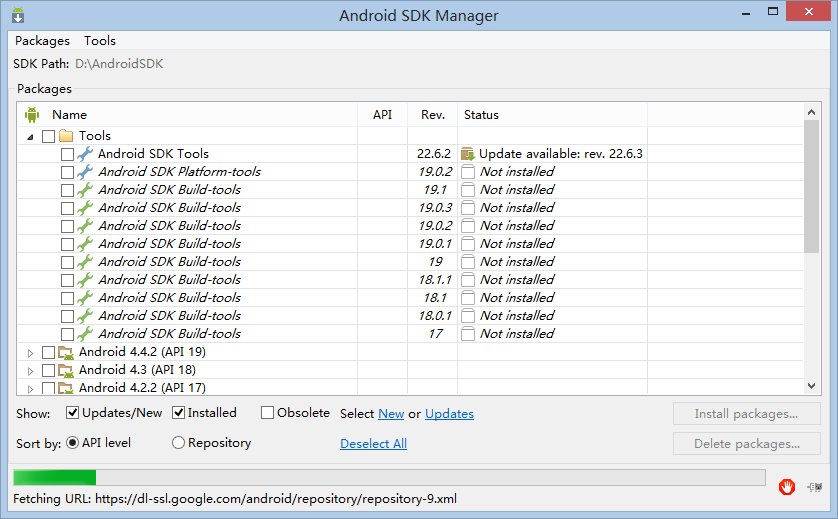
- List update completed After the update is complete, the log is displayed:
- Choose Download Items To use the Intel HAXM acceleration simulator, you must select the following items to download:
| Directory | Item | Purpose |
|---|---|---|
| Tools | Android SDK Platform-tools | Android platform tools, basic components |
| Android 4.4.2(API19) | SDK Platform | Android4.4.2 SDK,emulator basic components |
| Android 4.4.2(API19) | Intel x86 Atom System Image | Inter x86 Android4.4.2 emulator image file |
| Extras | Intel x86 Emulator Accelerator (HAXM installer) | Inter x86 Android eimulator hardware acceleration program |
After selecting the download item, as shown in the figure below:
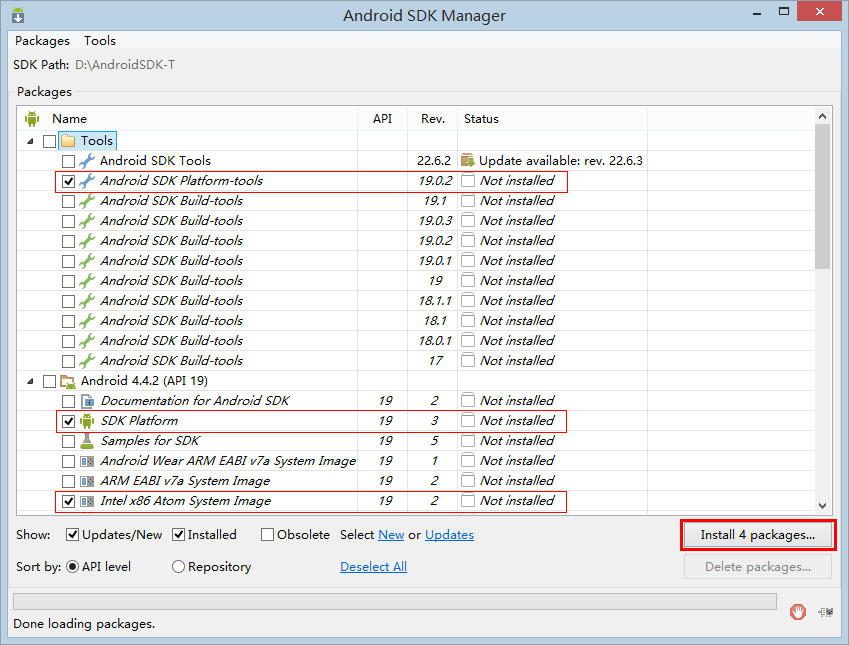
Choose “Intall 4 Packages…”, Start to download and install.
- Accept the license agreement
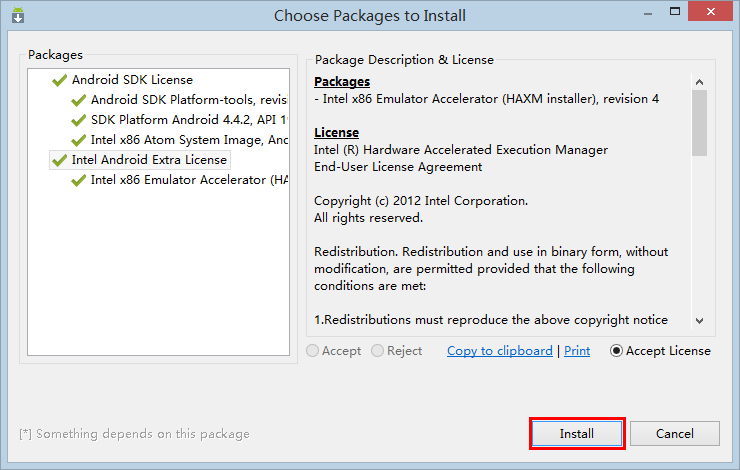
After selecting the items in the packages list on the right, select “Accept License” to accept the license agreement. Then click “Install” to start downloading.
- Start to download
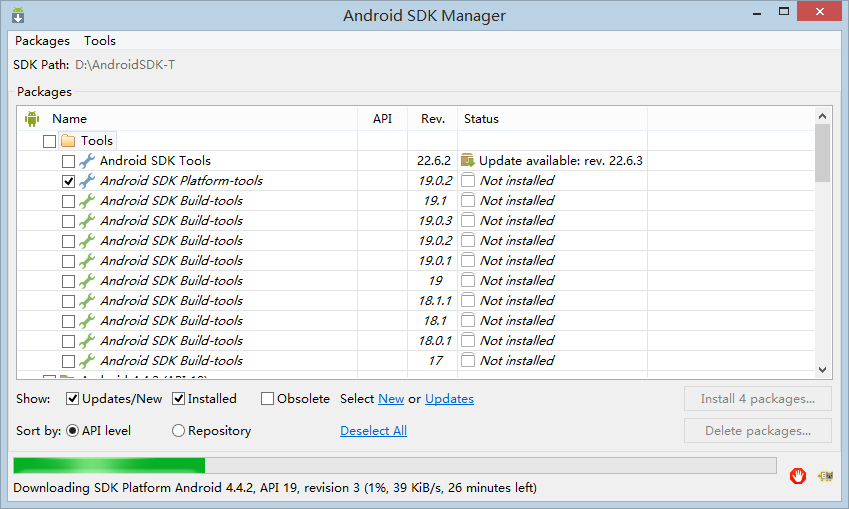
Because the SDK and emulator image files are large, the download time will be relatively long, and the domestic visit to the official Google website is not stable, and the download failure is often prompted:
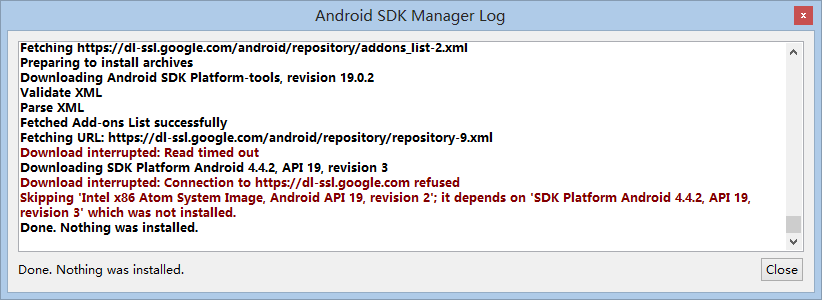
Close the prompt dialog and download again, or retry downloading after overriding the wall.
Install Intel X86HAXM
After downloading the Intel X86 HAXM plug-in, you need to run the installer in the download directory to install it. The directory is: “%ADT installation directory%\extras\intel\Hardware_Accelerated_Execution_Manager\”. Double-click to run intelhaxm.exe to install, the current new version is 1.0.8, if the lower version has been installed, it is recommended to upgrade.
- Start installation

Click “Next”。
- Configure HAXM to use maximum memory
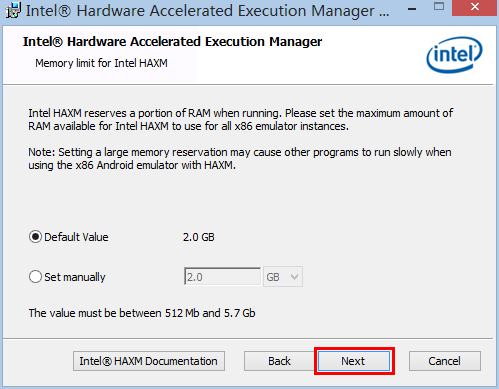 The installer will automatically calculate the recommended value, use the default value, select the next step “Next”.
- Confirm configuration
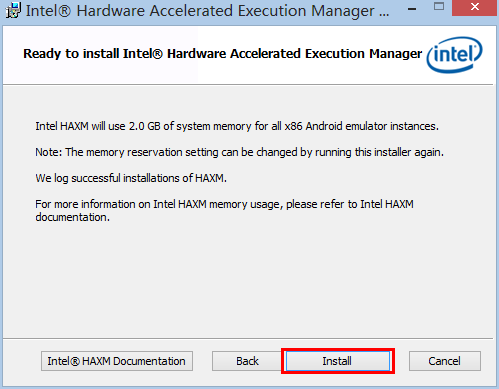 Click “Next”。
- Complete Installation

Create Emulator
The ADT tool comes with the Android Virtual Device Manager (Android Virtual Device Manager), you can double-click to run the “AVD Manager.exe” program in the Android SDK root directory (such as “D:\AndroidSDK”).
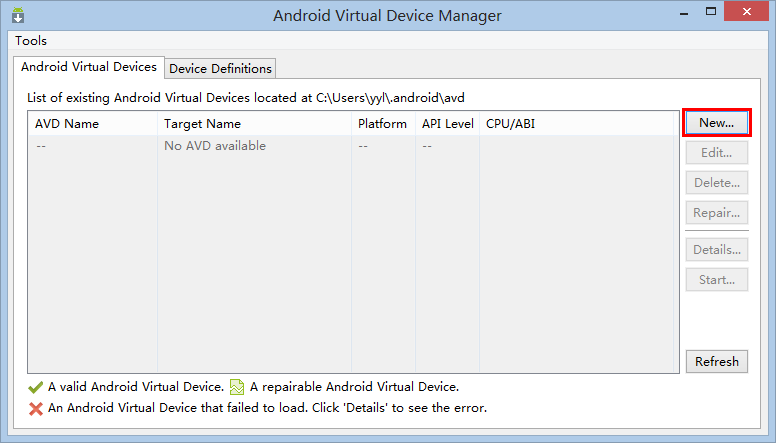
Since no emulator has been created, no available emulator is displayed in the list, click “New…” to start creating a new emulator.
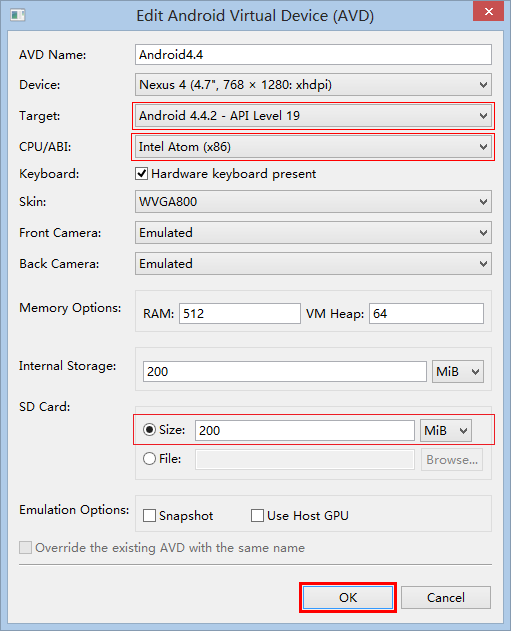
- Create emulator
| Item | Description |
|---|---|
| AVD Name | Emulator name, input according to hobbies |
| Device | Analog equipment, choose according to your hobby, it is recommended to choose according to the display resolution, large display selection is a high score ratio emulator |
| Target | Choose “Android 4.4.2 - API Level 19” |
| CPU/ABI | Choose “Intel Atom (x86)” |
| Skin | Emulator skin, choose according to hobbies, recommend choosing WVGA800 |
| Front Camera | For front camera, select “None” if you don’t need it, select “Emulated” for analog camera, select “WebCam0” for PC camera |
| Back Camera | Rear camera, similar to the front camera selection |
| Memory Options | Memory size, set according to PC memory size, recommended RAM: 512; Heap: 64 |
| Internal Storage | Internal memory size, set according to the size of the PC system disk space, 200M is recommended |
| SD Card | Internal memory size, set according to the size of the PC system disk space, 200M is recommended |
Note that the SD Card must be set up, otherwise it will not run on the real device. Complete installation, click “OK”
- Confirm Configration
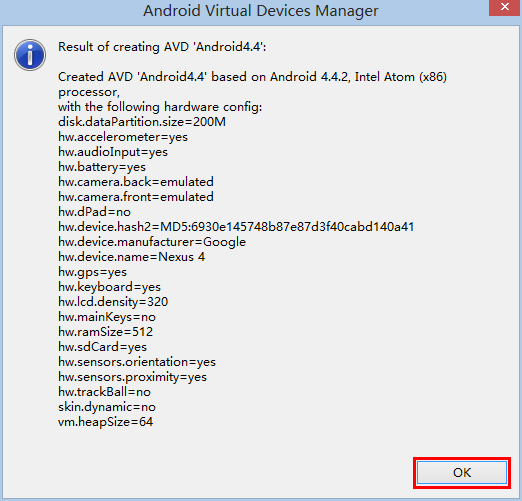
- After the creation is completed, it will be displayed in the emulator list
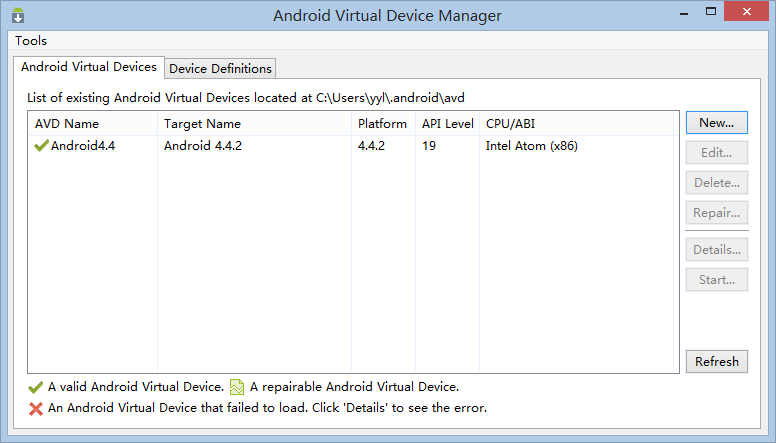
Start emulator
After creating the emulator, it can be displayed in the list every time you start the Android emulator management program

- Start emulator
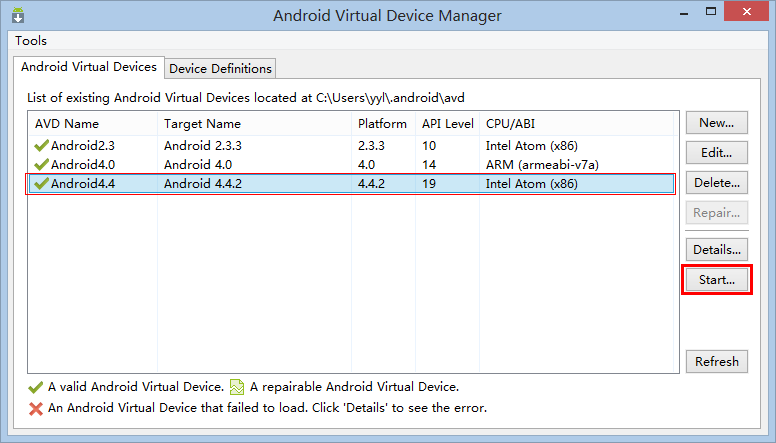 Choose “Android4.4.2” emulator, click “Start…” button.
- Set startup configuration
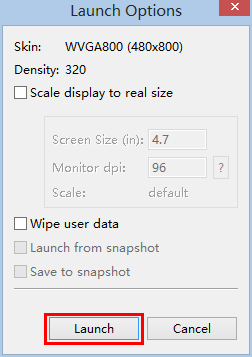
| Item | Description |
|---|---|
| Scale Display to real size | Whether to zoom to the set simulator resolution, used when the PC resolution is low |
| Wipe user data | Whether to erase user data, used when resetting the emulator |
Click “Launch” to start。
- Wait for the emulator to load
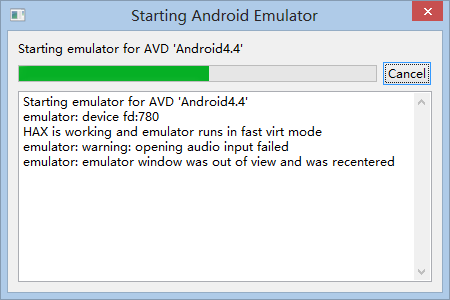
The configuration of the PC determines the speed, and wait patiently for the emulator to start.
- Finish starting the emulator

After the simulator is configured, you can connect through the real device running function of HBuilder. Refer to the “Application Debugging” chapter later.
Appendix: Use chrome to debug webview {#chromedebug}
After configuring the emulator or real device debugging environment, you can quickly debug the mobile application developed by HBuilder through Chrome’s DevTools tool.
Install HBuilder Application
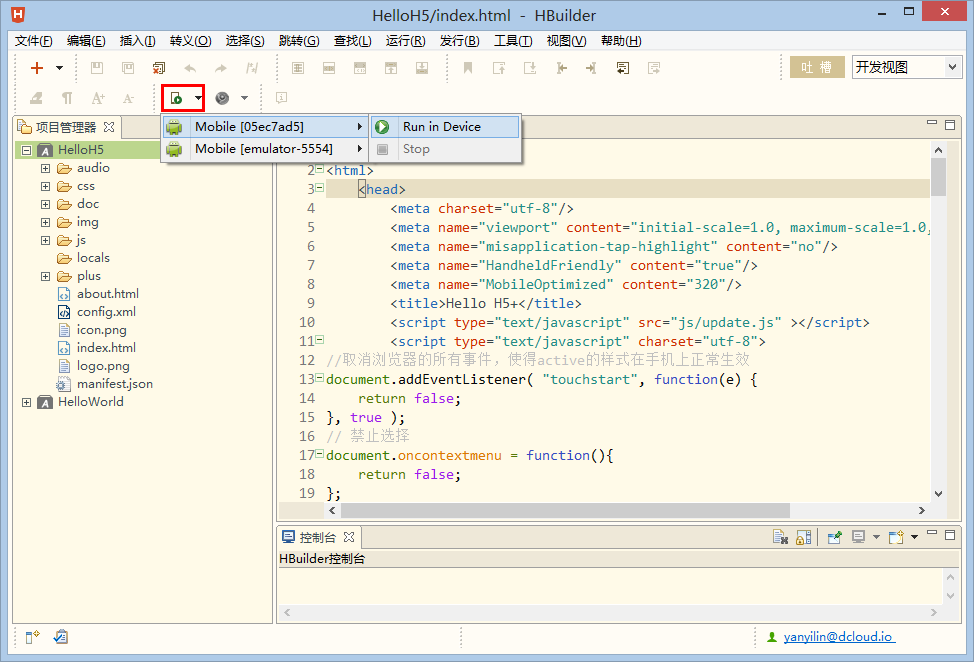
After starting HBuilder, it will automatically detect the device (emulator or real device) connected to the PC. After creating a “mobile App”, you can install the HBuilder application on the device for debugging in the following ways:
The shortcut key for running is Ctrl+R. It can also be operated by mouse (note that the button for run in device in the figure below no longer exists in the new version, just click on the phone)
- Through “Run” to start menu
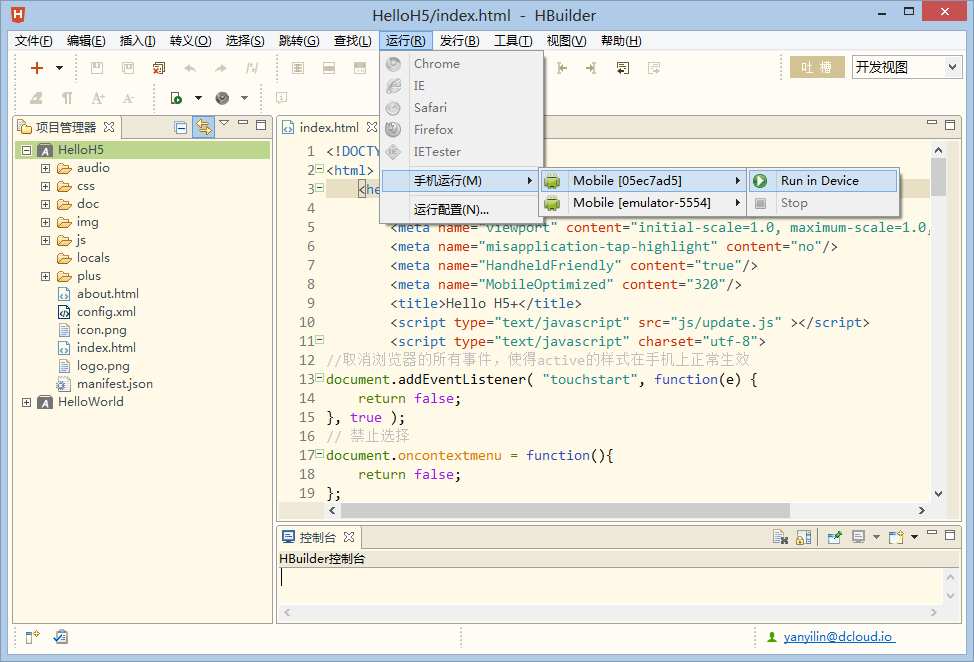
- Launch via toolbar
 After the HBuilder application is installed on the device, the application resources will be synchronized and run automatically.
- Emulator

- Real Device
 After the application is launched, you can connect to it for debugging through Chrome’s DevTools.
Use Chrome to debug
We recommend that developers directly use HBuilder for debugging, see above for details. This can avoid to use VPN. If you don’t use HBuilder’s debugging, but you want to use chrome to debug by yourself, you can watch the tutorial here, and pay attention to overcoming the wall. Check Chrome Version Chrome 30 and above only support debugging on Android devices. Open Chrome’s About page to view:
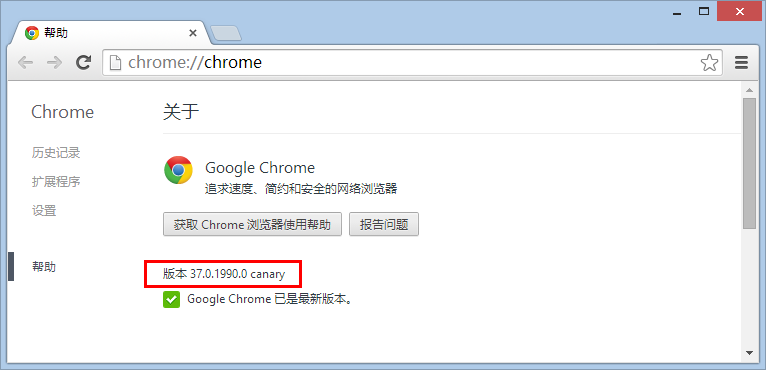 A minimum version of Chrome30 or above is required. If the version is too low, an updated version is required. The latest version is recommended.
Open the device check page
In the Chrome address bar, enter “chrome://inspect” or go to “Menu” -> “Tools” -> “Inspect Device” to open the device inspection page:
 The DevTools tool will automatically detect the list of debuggable pages running on the connected device. Click the “inspect” link of the corresponding page to open the debug page.If the screen above does not display a phone that can be debugged, please check the USB debugging mode or driver installation of the phone again according to the method mentioned above. At the same time, note that mobile phones below Android 4.4 cannot be debugged, and emulators such as Haima Play cannot be debugged.
If there is a mobile phone in the above interface, but there is no app that can be debugged, the possible reasons are as follows:
The DevTools tool will automatically detect the list of debuggable pages running on the connected device. Click the “inspect” link of the corresponding page to open the debug page.If the screen above does not display a phone that can be debugged, please check the USB debugging mode or driver installation of the phone again according to the method mentioned above. At the same time, note that mobile phones below Android 4.4 cannot be debugged, and emulators such as Haima Play cannot be debugged.
If there is a mobile phone in the above interface, but there is no app that can be debugged, the possible reasons are as follows:
- The HBuilder dock or other apps that need to be debugged on the mobile phone are not started or are not running any html pages;
- The app to be debugged rejected the debug request. The HBuilder debugging base opens debugging requests by default, but cloud-packaged or locally packaged apps close debugging requests by default. Cloud packaging is to configure whether to allow debugging in the manifest,
- Please inquire for detailsmanifest Configuration guide,local packaging must also configure debug=”true”, depending on the local packaging configuration environment。
Click “inspect”,if you start a white screen interface, it means that you have been walled. Because this service needs to connect to Google’s server Generally, you only need to call VPN when you use “inspect” for the first time, and it will be cached locally in the future. Developers can use the three-party pair service, but note that it is not possible to use chrome to debug by visiting google.com. Some circumvention software supports incomplete dns. The key is to ping chrometophone.appspot.com (this url may change with google adjustment service).
Another simple and easy way is to modify the local host. Here is a list of some hosts.。https://github.com/racaljk/hosts. Pay attention to timely updates. Pro-testing is feasible on July 25, 2016. Note that this host file involves many foreign domain names, and the unnecessary dns resolution can be deleted)
Note that the host file modification requires administrator rights under the window, the specific method is not described in this article, please Baidu by yourself.
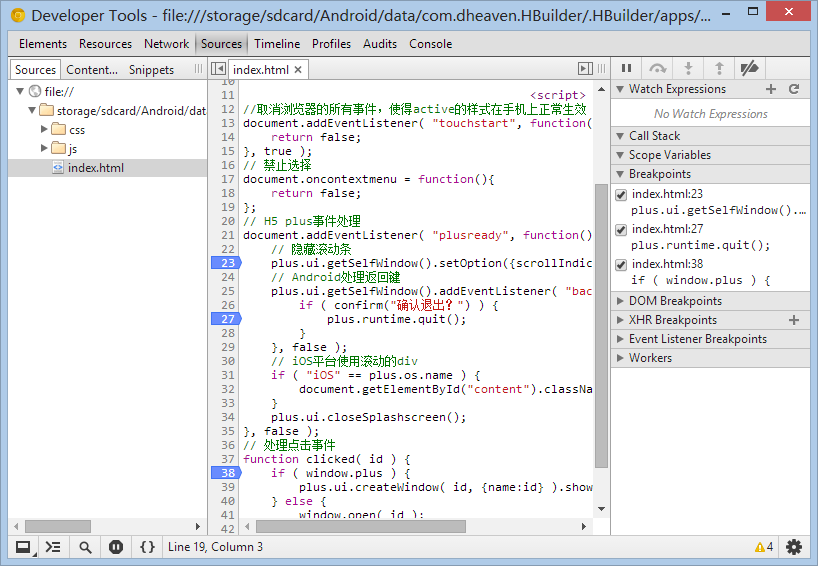
Page Adjustment After opening the debugging page, DevTools will automatically load the relevant resources, and the operation mode of the debugging page is exactly the same as that of the normal html debugging page.
- View the DOM structure under Elements

After the DOM element is selected, it will be highlighted on the device, and the CSS properties modified under Styles on the right can take effect immediately:

- Debug JavaScript with breakpoints under Sources
Press F5 to reload the page and restart debugging.
Note: Each Webview is a different list in the chrome candidate debugging list, and you need to click inspect separately. When you inspect WebviewA, click a button to open WebviewB. If you want to debug B, you need to return to the chrome://inspect/#devices page, find WebviewB, and click inspect.

若有收获,就点个赞吧
0 人点赞
