1.点、线、面
官方:链接
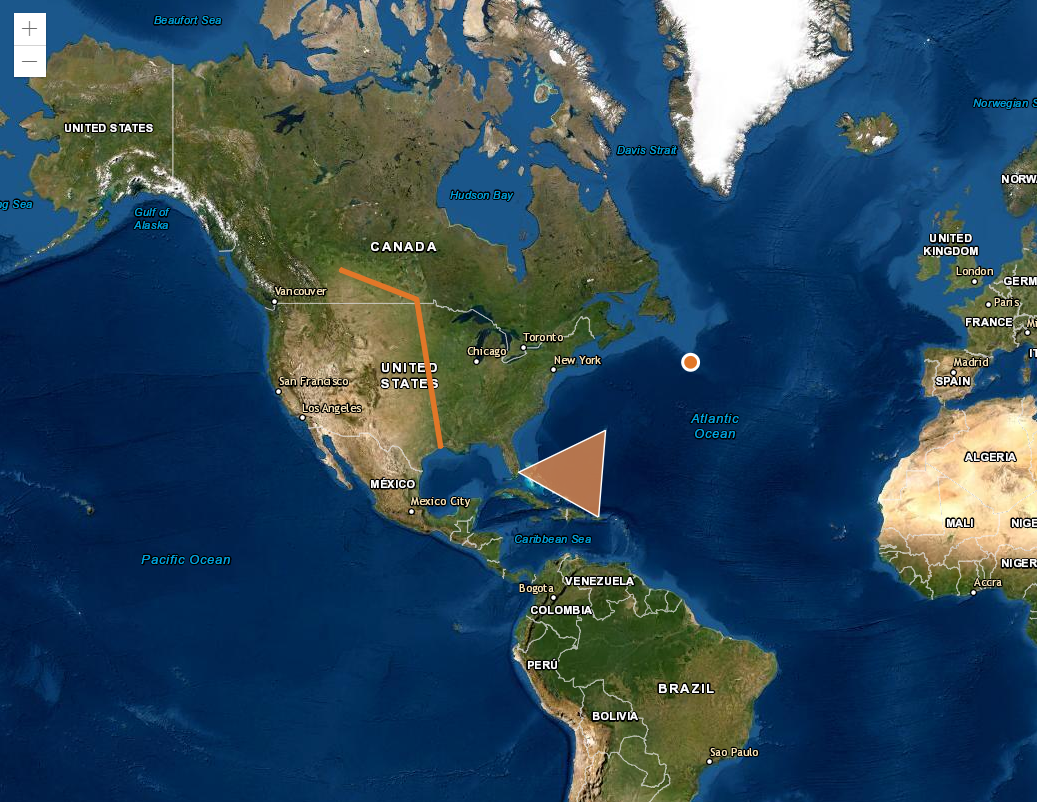
<html><head><meta charset="utf-8" /><meta name="viewport" content="initial-scale=1,maximum-scale=1,user-scalable=no" /><title>Intro to graphics | Sample | ArcGIS API for JavaScript 4.19</title><link rel="stylesheet" href="https://js.arcgis.com/4.19/esri/themes/light/main.css" /><script src="https://js.arcgis.com/4.19/"></script><style>html,body,#viewDiv {padding: 0;margin: 0;height: 100%;width: 100%;}</style><script>require(["esri/Map", "esri/views/MapView", "esri/Graphic"], (Map, MapView, Graphic) => {const map = new Map({basemap: "hybrid"});const view = new MapView({center: [-80, 35],container: "viewDiv",map: map,zoom: 3});/************************** Create a point graphic*************************/// First create a point geometry (this is the location of the Titanic)const point = {type: "point", // autocasts as new Point()longitude: -49.97,latitude: 41.73};// Create a symbol for drawing the pointconst markerSymbol = {type: "simple-marker", // autocasts as new SimpleMarkerSymbol()color: [226, 119, 40],outline: {// autocasts as new SimpleLineSymbol()color: [255, 255, 255],width: 2}};// Create a graphic and add the geometry and symbol to itconst pointGraphic = new Graphic({geometry: point,symbol: markerSymbol});/***************************** Create a polyline graphic****************************/// First create a line geometry (this is the Keystone pipeline)const polyline = {type: "polyline", // autocasts as new Polyline()paths: [[-111.3, 52.68], [-98, 49.5], [-93.94, 29.89]]};// Create a symbol for drawing the lineconst lineSymbol = {type: "simple-line", // autocasts as SimpleLineSymbol()color: [226, 119, 40],width: 4};// Create an object for storing attributes related to the lineconst lineAtt = {Name: "Keystone Pipeline",Owner: "TransCanada",Length: "3,456 km"};/******************************************** Create a new graphic and add the geometry,* symbol, and attributes to it. You may also* add a simple PopupTemplate to the graphic.* This allows users to view the graphic's* attributes when it is clicked.******************************************/const polylineGraphic = new Graphic({geometry: polyline,symbol: lineSymbol,attributes: lineAtt,popupTemplate: {// autocasts as new PopupTemplate()title: "{Name}",content: [{type: "fields",fieldInfos: [{fieldName: "Name"},{fieldName: "Owner"},{fieldName: "Length"}]}]}});/**************************** Create a polygon graphic***************************/// Create a polygon geometryconst polygon = {type: "polygon", // autocasts as new Polygon()rings: [[-64.78, 32.3], [-66.07, 18.45], [-80.21, 25.78], [-64.78, 32.3]]};// Create a symbol for rendering the graphicconst fillSymbol = {type: "simple-fill", // autocasts as new SimpleFillSymbol()color: [227, 139, 79, 0.8],outline: {// autocasts as new SimpleLineSymbol()color: [255, 255, 255],width: 1}};// Add the geometry and symbol to a new graphicconst polygonGraphic = new Graphic({geometry: polygon,symbol: fillSymbol});// Add the graphics to the view's graphics layerview.graphics.addMany([pointGraphic, polylineGraphic, polygonGraphic]);});</script></head><body><div id="viewDiv"></div></body></html>

若有收获,就点个赞吧
0 人点赞
