自 G2 2.0.x 版本开始我们添加了自定义 Shape 的机制,以支持部分有 高订制需求的 图表可视化需求。这也是 G2 在向 可编程可视化引擎 迈出的重要一步。
const Shape = G2.Shape;Shape.registerShape(geomName, shapeName, { // 向Shape工厂注册某个geom的一个shapegetPoints(cfg) {}, // 自定义具体标记点draw(cfg, container) {} // 自定义最终绘制});
上述 7 行的代码片段即使自定义 Shape 的所有接口。
geomName 几何标记名, 如 point, line 等
shapeName 注册的具体图形名,自定义的图形的名称
getPoints 自定义形状绘制时需要的节点,比如柱状图需要 4 个节点
draw 执行图形绘制逻辑、调用绘图引擎
上述方法更详细的使用说明详见: Shape API。
1分钟上手自定义 Shape
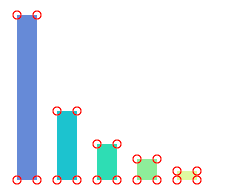
以柱状图举例,几何标记 interval 会给出四个关键点(即组成矩形的四个顶点),然后将这四个点依次连接,得到每个柱子的形状。红色圆形 标记就是几何标记点。默认的柱状图就是通过四个几何标记点,依次相连后得到的。
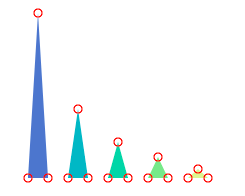
下面的我们使用自定义 shape 的功能,把上面的柱状图的柱子变成三角形,即如下图所示:
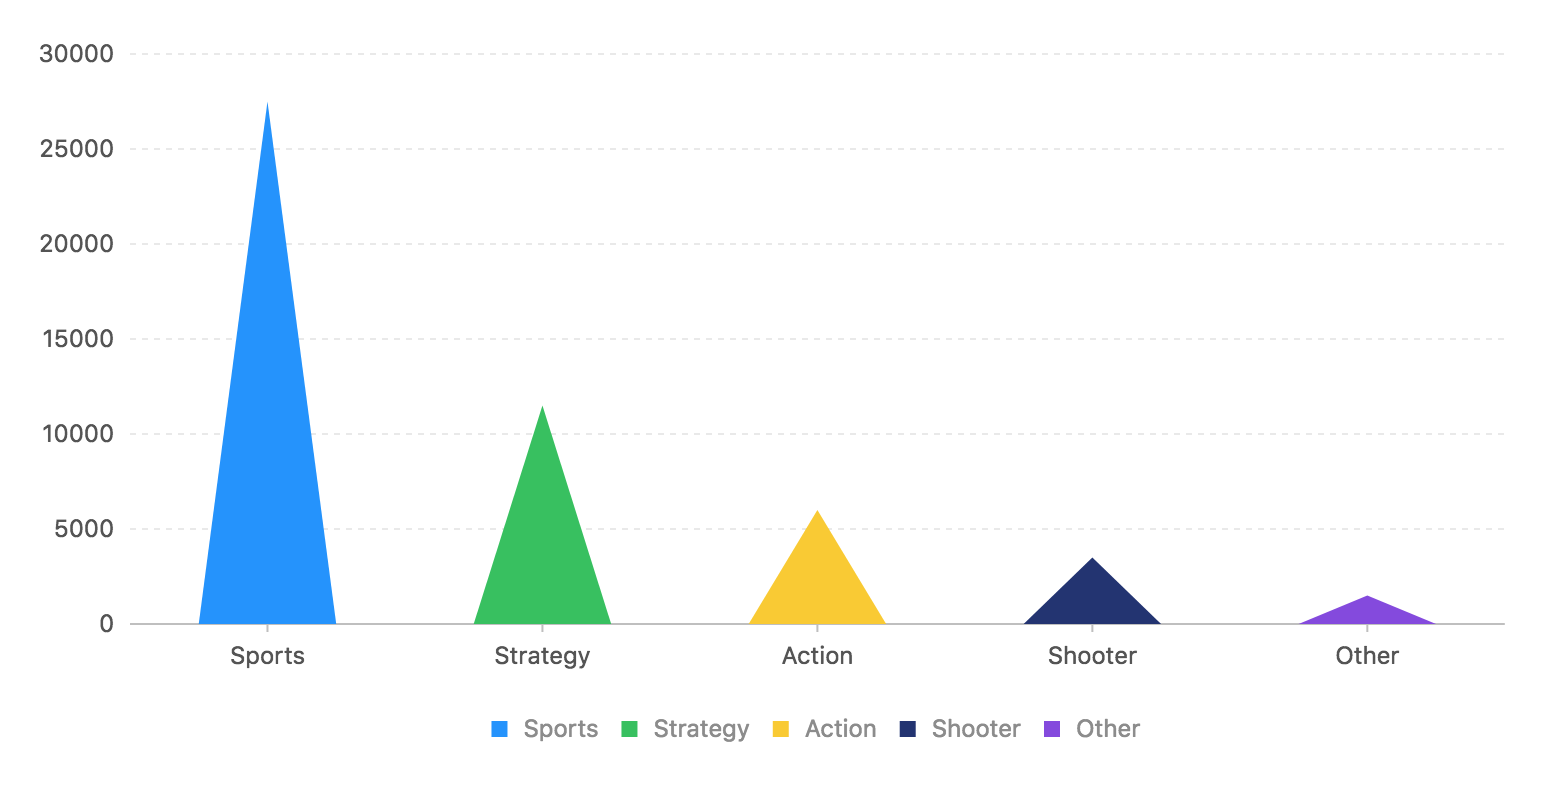
const Shape = G2.Shape;Shape.registerShape('interval', 'triangle', {getPoints(cfg) {const x = cfg.x;const y = cfg.y;const y0 = cfg.y0;const width = cfg.size;return [{ x: x - width / 2, y: y0 },{ x: x, y: y },{ x: x + width / 2, y: y0 }]},draw(cfg, group) { // 自定义最终绘制const points = this.parsePoints(cfg.points); // 将0-1空间的坐标转换为画布坐标const polygon = group.addShape('polygon', {attrs: {points: [[ points[0].x, points[0].y ],[ points[1].x, points[1].y ],[ points[2].x, points[2].y ]],fill: cfg.color}});return polygon; // !必须返回 shape}});const data = [{ genre:'Sports', sold:27500 },{ genre:'Strategy', sold:11500 },{ genre:'Action', sold:6000 },{ genre:'Shooter', sold:3500 },{ genre:'Other', sold:1500 }];const chart = new G2.Chart({container: 'c1',forceFit: true,height: 400,padding: [ 20, 80, 95, 80 ]});chart.source(data);chart.interval().position('genre*sold').color('genre').shape('triangle');chart.render();
以下是自定义三角形柱状图的代码:
Shape.registerShape('interval', 'triangle', {// 返回三角形的三个顶点getPoints(cfg) {const x = cfg.x;const y = cfg.y;const y0 = cfg.y0;const width = cfg.size;return [{ x: x - width / 2, y: y0 },{ x: x, y: y },{ x: x + width / 2, y: y0 }]},// 绘制三角形draw(cfg, group) { // 自定义最终绘制const points = this.parsePoints(cfg.points); // 将0-1空间的坐标转换为画布坐标const polygon = group.addShape('polygon', {attrs: {points: [[ points[0].x, points[0].y ],[ points[1].x, points[1].y ],[ points[2].x, points[2].y ]],fill: cfg.color}});return polygon; // !必须返回 shape}});
上面代码中,我们进行了三步操作:
通过
getPoints()方法返回三角形的三个关键点(即三个顶点)。此时 cfg 中会传入,x, y, y0, size。其中 x, y 是柱子最高点的坐标,y0 是横坐标轴的 y 坐标,size 是柱子默认宽度。得到标记点后,我们在
draw()方法中拿到 cfg.points 数据和数据映射后的图形属性数据(比如 cfg.color),再通过绘图库提供的多边形图形,将三个点依次头尾相连,生成每个三角形。通过 addShap 来绘制图形,addShape 的参数参考: 绘图文档
注意:points 数据和参与 points 计算的配置项都是 0-1 空间的数据!

若有收获,就点个赞吧
0 人点赞
